




 1
1




- My Forums
- Tiger Rant
- LSU Recruiting
- SEC Rant
- Saints Talk
- Pelicans Talk
- More Sports Board
- Fantasy Sports
- Golf Board
- Soccer Board
- O-T Lounge
- Tech Board
- Home/Garden Board
- Outdoor Board
- Health/Fitness Board
- Movie/TV Board
- Book Board
- Music Board
- Political Talk
- Money Talk
- Fark Board
- Gaming Board
- Travel Board
- Food/Drink Board
- Ticket Exchange
- TD Help Board
Customize My Forums- View All Forums
- Show Left Links
- Topic Sort Options
- Trending Topics
- Recent Topics
- Active Topics
Started By
Message
re: Daily COVID Updated as of 11/2/20 8:00 PM
Posted on 4/15/20 at 12:47 pm to Chromdome35
Posted on 4/15/20 at 12:47 pm to Chromdome35
What’s the negative value? Is that just a big lump of recoveries getting accounted for?
Posted on 4/15/20 at 12:49 pm to Jrv2damac
Are you talking about in Active Cases?
If so, I suppose it means that for the first time since this started, we had a decline in the # of active cases.
The number of recoveries had a big jump today.
If so, I suppose it means that for the first time since this started, we had a decline in the # of active cases.
The number of recoveries had a big jump today.
This post was edited on 4/15/20 at 12:53 pm
Posted on 4/15/20 at 12:56 pm to Chromdome35
That’s a big decline and it just screamed at me
Posted on 4/15/20 at 1:19 pm to Jrv2damac
If I’m correct that these are final day numbers, Italy just posted their lowest number of new cases since March 13th.
Posted on 4/15/20 at 1:25 pm to ValDawgsta
Italy is probably final, they don't seem to update more than once a day.
Germany, on the other hand, will update constantly all day long.
Germany, on the other hand, will update constantly all day long.
Posted on 4/15/20 at 1:50 pm to Chromdome35
Man France got hammered today
Posted on 4/15/20 at 3:20 pm to Microtiger
Thats the same graphic (without the animation) that is on my tracker, bottom left two graphs.
I got the theory for my graphs from the minute physics video that your link gives credit to.
I got the theory for my graphs from the minute physics video that your link gives credit to.
Posted on 4/15/20 at 3:28 pm to Chromdome35
New deaths are up to 2,259 already today.
The IHME modeling should be thrown away.
The IHME modeling should be thrown away.
Posted on 4/15/20 at 3:29 pm to Chromdome35
wtf is up with the deaths today (and yesterday). Not whats expected.
Posted on 4/15/20 at 3:31 pm to baybeefeetz
Random deaths are getting labelled as COVID19 deaths. Death numbers are no longe reliable.
Posted on 4/15/20 at 3:34 pm to baybeefeetz
Yesterday a bump was expected, most of us didn't think it would be as large a bump as it was.
Massachusetts recorded a large jump for today of 151 deaths vs 113 yesterday.
I saw where NY mentioned new CDC reporting guidelines, I'm wondering if the states are starting to implement those which accounts for the increase?
Massachusetts recorded a large jump for today of 151 deaths vs 113 yesterday.
I saw where NY mentioned new CDC reporting guidelines, I'm wondering if the states are starting to implement those which accounts for the increase?
Posted on 4/15/20 at 3:41 pm to Chromdome35
quote:The IMHE modeling assumes a symmetrical, normal distribution for each population or models (e.g., states for US data; national data is just their aggregates) and it appears to vastly underestimate the plateauing and/or the slower decrease on the backside of the distribution.
The IHME modeling should be thrown away.
There are more technical discussions by statisticians and epidemiologists on Twitter, but I can link those discussions if anyone is interested.
This post was edited on 4/15/20 at 3:42 pm
Posted on 4/15/20 at 3:44 pm to buckeye_vol
How much conversation is centered around the quality and timeliness of the data?
I wouldn't mind seeing it even though I probably won't understand it. Maybe I'll learn something.
I wouldn't mind seeing it even though I probably won't understand it. Maybe I'll learn something.
This post was edited on 4/15/20 at 3:45 pm
Posted on 4/15/20 at 3:52 pm to Chromdome35
quote:I think we’re all just assuming that these are measurement errors that will hopefully be able to modeled as random error.
How much conversation is centered around the quality and timeliness of the data?
But here are a couple good threads about the model:
How it models hospitalizations
The statistical assumptions
Posted on 4/15/20 at 3:54 pm to baybeefeetz
This is what we saw in Italy. Basically the measures are taking R0 to somewhere around 1, maybe a little below. Which means there will be a long, flat tail.
Posted on 4/15/20 at 4:41 pm to frogglet
Like your woman
Posted on 4/15/20 at 5:48 pm to Jrv2damac
Chrome,
Sum Teen Wong with the 'days to double' numbers for new cases in your country comparisons bar charts.
Good work dude!
Posted on 4/15/20 at 5:58 pm to frogglet
Not that flat of a tail but yes there will be a tail. The truth is this thing will be under 1000 deaths consistently by the time it’s May.
The Republic is built by States. The States who are healthier and smaller or smarter should open when they determine its safe. If the States don’t, the People will.
The Republic is built by States. The States who are healthier and smaller or smarter should open when they determine its safe. If the States don’t, the People will.
Posted on 4/15/20 at 6:06 pm to Nawlens Gator
Thanks, I think i fixed it
Posted on 4/15/20 at 7:36 pm to Chromdome35
This is the link to the US state level tracker that I have shared via Google Drive. Chromdome's State Level COVID-19 Daily Tracker
This is the link to the COVID-19 Country tracker that I have shared on Google Drive. Chromdome's COVID-19 Daily Tracker
The source for the data is https://www.worldometers.info/coronavirus/
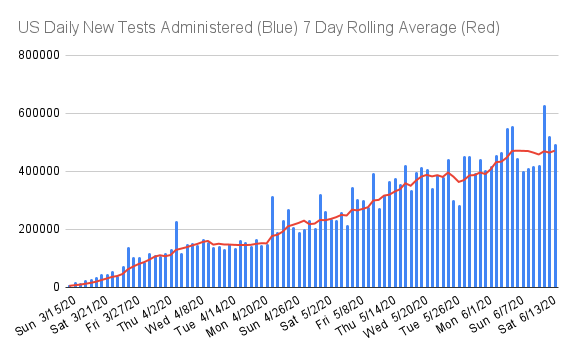
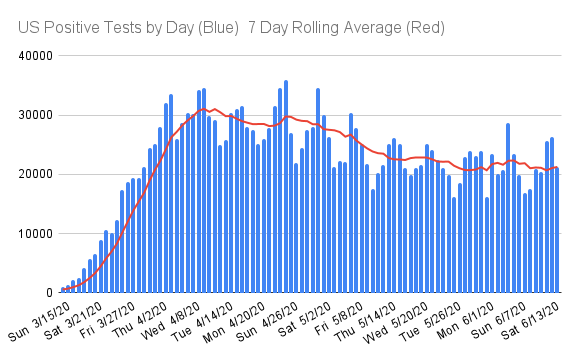
The source for the testing data is from https://covidtracking.com/data/
NOTE: The daily growth rate data will not be accurate until the end of the day's postings. It will change throughout the day.
NOTE: I am not a mathematician, statistics guru, scientist, sharpest tack in the box, I'm just a guy who likes to understand for myself what is happening and to share it with others. This thread was not created to debate if you should or shouldn't take this seriously, it is simply to present the numbers and foster conversation.
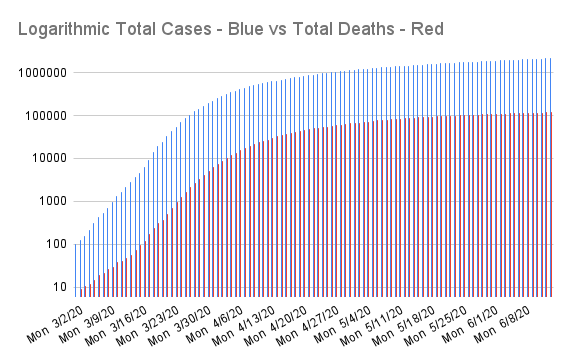
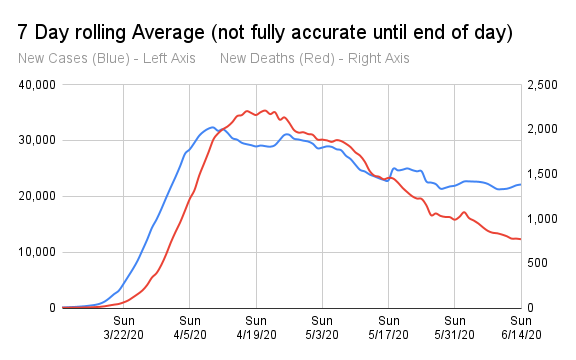
NOTE: 4/15/20 I am changing the graphs in these posts. The Daily Growth Rate of Cases graph is not meaningful at this point. I am replacing it with a graph showing a 7 day rolling average of new cases and deaths. I'm also adding a couple of graphs to show # of tests given and the # of positive test results by day.




This is the link to the COVID-19 Country tracker that I have shared on Google Drive. Chromdome's COVID-19 Daily Tracker
The source for the data is https://www.worldometers.info/coronavirus/
The source for the testing data is from https://covidtracking.com/data/
NOTE: The daily growth rate data will not be accurate until the end of the day's postings. It will change throughout the day.
NOTE: I am not a mathematician, statistics guru, scientist, sharpest tack in the box, I'm just a guy who likes to understand for myself what is happening and to share it with others. This thread was not created to debate if you should or shouldn't take this seriously, it is simply to present the numbers and foster conversation.
NOTE: 4/15/20 I am changing the graphs in these posts. The Daily Growth Rate of Cases graph is not meaningful at this point. I am replacing it with a graph showing a 7 day rolling average of new cases and deaths. I'm also adding a couple of graphs to show # of tests given and the # of positive test results by day.

 Page 178 of 331



Popular

Back to top
 Follow TigerDroppings for LSU Football News