




 1
1




- My Forums
- Tiger Rant
- LSU Score Board
- LSU Recruiting
- SEC Rant
- SEC Score Board
- Saints Talk
- Pelicans Talk
- More Sports Board
- Fantasy Sports
- Golf Board
- Soccer Board
- O-T Lounge
- Tech Board
- Home/Garden Board
- Outdoor Board
- Health/Fitness Board
- Movie/TV Board
- Book Board
- Music Board
- Political Talk
- Money Talk
- Fark Board
- Gaming Board
- Travel Board
- Food/Drink Board
- Ticket Exchange
- TD Help Board
Customize My Forums- View All Forums
- Show Left Links
- Topic Sort Options
- Trending Topics
- Recent Topics
- Active Topics
Started By
Message
re: Daily COVID Updated as of 11/2/20 8:00 PM
Posted on 4/15/20 at 9:35 am to Engineer22
Posted on 4/15/20 at 9:35 am to Engineer22
quote:
New York 203,123 10,834 175,200 10,354 552 499,143 25,443
The question is how many deaths outside of NYC?
10,834 is the statewide number. You know the city number (you quoted it) and you know the approximate number of "probable" deaths included in the city's number (again you quoted it) so it should be easy for an "engineer" to figure out.
This post was edited on 4/15/20 at 9:47 am
Posted on 4/15/20 at 9:39 am to mmcgrath
They may not be included in his total, but they are in the number the MSM and everyone else is reporting.

This post was edited on 4/15/20 at 9:44 am
Posted on 4/15/20 at 9:51 am to nerd guy
(Reuters) - Abbott Laboratories Inc said on Wednesday it launched a coronavirus blood test that could show whether a person has been infected and plans to ramp up manufacturing to produce 20 million tests per month by June.
The test helps identify disease-fighting antibodies in people who have been infected but may have had mild symptoms or none at all, making it different from the current diagnostic tests that require nasal swabs to confirm active infection.
Antibody tests are considered a potential game changer in the battle to contain infections and offers the chance to get the economy back on track by identifying people who may have immunity to the virus and could return to their jobs.
New Abbott Test
The test helps identify disease-fighting antibodies in people who have been infected but may have had mild symptoms or none at all, making it different from the current diagnostic tests that require nasal swabs to confirm active infection.
Antibody tests are considered a potential game changer in the battle to contain infections and offers the chance to get the economy back on track by identifying people who may have immunity to the virus and could return to their jobs.
New Abbott Test
Posted on 4/15/20 at 10:23 am to auisssa
not really relevant to the stats here but just venting
had an HIV patient on hemodialysis, intubated and rapidly deteriorating from covid19
family insists on full code

had an HIV patient on hemodialysis, intubated and rapidly deteriorating from covid19
family insists on full code
Posted on 4/15/20 at 10:39 am to Tiguar
quote:
family insists on full code
For love...or money?
I have had patients family follow this exact same pattern and say, out loud to me, "I can't make it without their check".
It sickens me.
Posted on 4/15/20 at 10:41 am to Engineer22
quote:
I appreciate the work that you guys are trying to do, but GARBAGE IN = GARBAGE OUT. The data that you are getting is crap. We won't have a clue how many people actually died from COVID-19 for a while. It will take real statistical work which this is not...
I think you would appreciate this not widely known but really neat visualization of the data.
Covid Trends
It shows all the numbers from all the countries, appearing and increasing on the map over time. I suggest clicking "select all" on the right side and clicking play to see them all follow almost the same exact path - increasing at the exact same exponential slope until dropping like a rock a certain amount of time after lockdown. The US is just starting to peak at the very end.
Sure, some of the data here and there is bound to be inaccurate. But with the pooled data of every single country, you have to imagine that signal outweighs the noise.
Posted on 4/15/20 at 10:42 am to Chromdome35
... and SORRY about my comment earlier. Re-read it and saw that I sounded like a pompous a-hole.
I appreciate your time and effort in putting this together and keeping it updated.
I appreciate your time and effort in putting this together and keeping it updated.
Posted on 4/15/20 at 10:49 am to Microtiger
quote:
I think you would appreciate this not widely known but really neat visualization of the data.
That's pretty cool. Would be even better with Sweden and maybe Brazil in it also.
ETA: found the right buttons to add them...carry on.
This post was edited on 4/15/20 at 10:51 am
Posted on 4/15/20 at 10:49 am to Microtiger
That is an interesting trend. Sampling may help cover the disproportionate amount of testing / cases that are being reported in the US. Looks like Japan may be heading in the wrong direction also when I figured their cases would be dropping off like the rest of Asia.
Posted on 4/15/20 at 10:54 am to auisssa
So I can assume that it will be specific to covid 19 and not "coronavirus"??
Posted on 4/15/20 at 10:56 am to Tiguar
quote:
had an HIV patient on hemodialysis, intubated and rapidly deteriorating from covid19
family insists on full code
That's absolutely terrible. I've seen some of our residents code status changed ... once the family FINALLY returned the facilities calls.
Posted on 4/15/20 at 10:57 am to DMAN1968
quote:
For love...or money?
I have had patients family follow this exact same pattern and say, out loud to me, "I can't make it without their check".
It sickens me.
Where I work many times it has been for money ... sadly. Wife was bitching about the resident in front of him but wouldn't agree to change the code status to what was appropriate for his condition.
Posted on 4/15/20 at 10:59 am to Engineer22
quote:
Looks like Japan may be heading in the wrong direction also when I figured their cases would be dropping off like the rest of Asia.
Yes, it's very interesting. You can see the start of a drop where everyone assumed they'd drop just like Hong Kong did, and everyone was wondering "what Japan did different" culturally or otherwise. Looks like that was a little premature.
Posted on 4/15/20 at 11:25 am to Engineer22
It's all good!
Posted on 4/15/20 at 11:29 am to Chromdome35
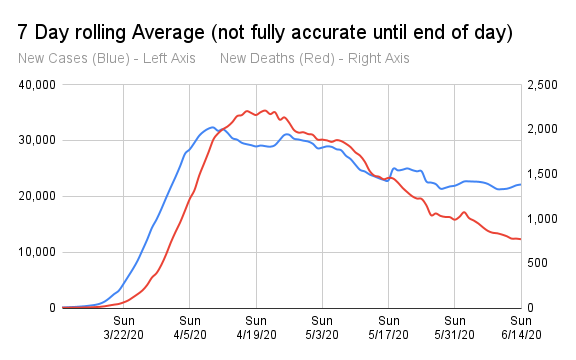
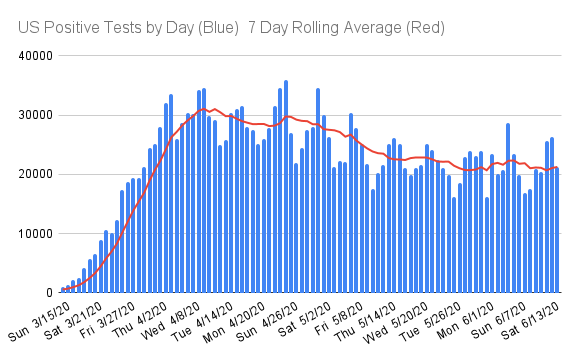
FYI...I am going to change up the graphs in my status posts.
I'm going to remove the Daily Growth Rate of New CV Cases chart and replace it with a 7 day rolling average chart of new cases and deaths. This should give the viewer a better representation of the movement in the numbers.
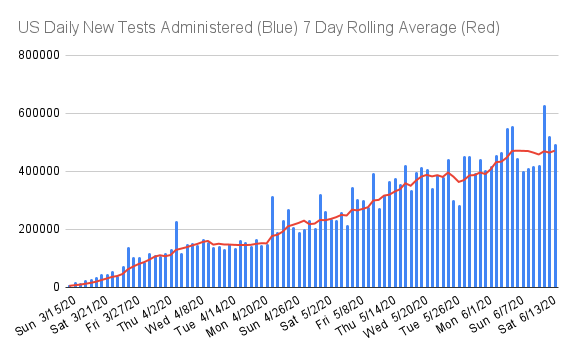
I'm also going to add a chart showing the number of tests administered by day and the % positive rate.
I'm going to remove the Daily Growth Rate of New CV Cases chart and replace it with a 7 day rolling average chart of new cases and deaths. This should give the viewer a better representation of the movement in the numbers.
I'm also going to add a chart showing the number of tests administered by day and the % positive rate.
Posted on 4/15/20 at 11:32 am to tiger91
Yes, it's Covid-19 specific
Posted on 4/15/20 at 11:46 am to tiger91
quote:
So I can assume that it will be specific to covid 19 and not "coronavirus"??
Yes. And the IgM test should be coming along not far behind it.
Posted on 4/15/20 at 11:57 am to nerd guy
Louisiana numbers since yesterday reporting
441 more cases
90 more deaths
35 less hospital admissions
11 less vents
441 more cases
90 more deaths
35 less hospital admissions
11 less vents
Posted on 4/15/20 at 12:17 pm to tiger91
The expected transition of faster rise in deaths and slower rise of new cases throughout the days is now happening. Meaning, when deaths are being reported, there isn't a continuous massive increase in new cases going with it.
We will see where the numbers finish, but 5,5445 at lunch is a small number.
We will see where the numbers finish, but 5,5445 at lunch is a small number.
Posted on 4/15/20 at 12:31 pm to Chromdome35
This is the link to the US state level tracker that I have shared via Google Drive. Chromdome's State Level COVID-19 Daily Tracker
This is the link to the COVID-19 Country tracker that I have shared on Google Drive. Chromdome's COVID-19 Daily Tracker
The source for the data is https://www.worldometers.info/coronavirus/
The source for the testing data is from https://covidtracking.com/data/
NOTE: The daily growth rate data will not be accurate until the end of the day's postings. It will change throughout the day.
NOTE: I am not a mathematician, statistics guru, scientist, sharpest tack in the box, I'm just a guy who likes to understand for myself what is happening and to share it with others. This thread was not created to debate if you should or shouldn't take this seriously, it is simply to present the numbers and foster conversation.
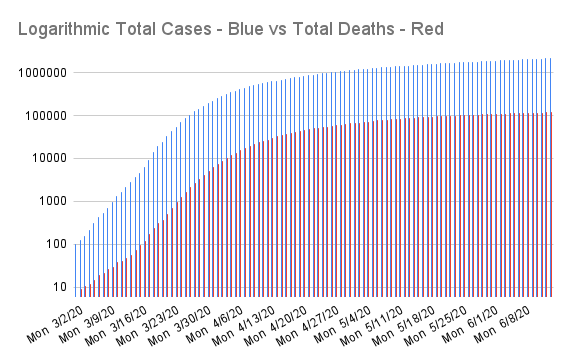
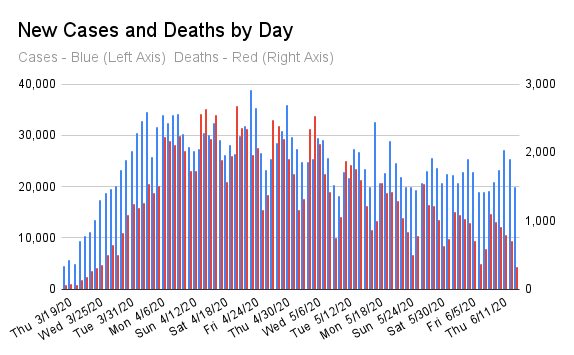
NOTE: 4/15/20 I am changing the graphs in these posts. The Daily Growth Rate of Cases graph is not meaningful at this point. I am replacing it with a graph showing a 7 day rolling average of new cases and deaths. I'm also adding a couple of graphs to show # of tests given and the # of positive test results by day.


This is the link to the COVID-19 Country tracker that I have shared on Google Drive. Chromdome's COVID-19 Daily Tracker
The source for the data is https://www.worldometers.info/coronavirus/
The source for the testing data is from https://covidtracking.com/data/
NOTE: The daily growth rate data will not be accurate until the end of the day's postings. It will change throughout the day.
NOTE: I am not a mathematician, statistics guru, scientist, sharpest tack in the box, I'm just a guy who likes to understand for myself what is happening and to share it with others. This thread was not created to debate if you should or shouldn't take this seriously, it is simply to present the numbers and foster conversation.
NOTE: 4/15/20 I am changing the graphs in these posts. The Daily Growth Rate of Cases graph is not meaningful at this point. I am replacing it with a graph showing a 7 day rolling average of new cases and deaths. I'm also adding a couple of graphs to show # of tests given and the # of positive test results by day.
This post was edited on 4/15/20 at 12:49 pm

 Page 177 of 331



Popular

Back to top
 Follow TigerDroppings for LSU Football News