




 1
1









- My Forums
- Tiger Rant
- LSU Score Board
- LSU Recruiting
- SEC Rant
- SEC Score Board
- Saints Talk
- Pelicans Talk
- More Sports Board
- Fantasy Sports
- Golf Board
- Soccer Board
- O-T Lounge
- Tech Board
- Home/Garden Board
- Outdoor Board
- Health/Fitness Board
- Movie/TV Board
- Book Board
- Music Board
- Political Talk
- Money Talk
- Fark Board
- Gaming Board
- Travel Board
- Food/Drink Board
- Ticket Exchange
- TD Help Board
Customize My Forums- View All Forums
- Show Left Links
- Topic Sort Options
- Trending Topics
- Recent Topics
- Active Topics
Started By
Message
re: Daily COVID Updated as of 11/2/20 8:00 PM
Posted on 4/13/20 at 4:48 pm to the808bass
Posted on 4/13/20 at 4:48 pm to the808bass
quote:
Speculation: with more people more isolated, viral load may be lower for positive cases leading to easier recoveries?
If the deaths are lagging by two weeks this doesn't make a lot of sense.
I'm going with better treatment options and healthcare in the US.
Posted on 4/13/20 at 4:48 pm to the808bass
quote:
But when we were relying on a reason for testing (travel, known contact with someone infected), we were delaying testing
this will go down as the 1 major screw up that fricked everything and what I got roasted on here for.
if we said "theres community spread here, lets test everyone with symptoms" in Feb then we wouldnt have over-corrected wondering how prevalent this was and bracing for a wave that never came
that original cdc recommendation to not test without history of travel/known contact fricked us real good
Posted on 4/13/20 at 5:40 pm to Tiguar
Looking good for new case numbers as we hit the end of the day. We will see where it finishes but looking positive.
Posted on 4/13/20 at 6:12 pm to TigerCruise
quote:
I'm going with better treatment options and healthcare in the US.
This is undoubtedly the case.
Posted on 4/13/20 at 6:30 pm to uppermidwestbama
25K isn't bad
~1500 deaths at dinner time and that's probably with some bleed over from the weekend?
~1500 deaths at dinner time and that's probably with some bleed over from the weekend?
Posted on 4/13/20 at 7:00 pm to Tiguar
quote:
this will go down as the 1 major screw up that fricked everything and what I got roasted on here for. if we said "theres community spread here, lets test everyone with symptoms" in Feb then we wouldnt have over-corrected wondering how prevalent this was and bracing for a wave that never came that original cdc recommendation to not test without history of travel/known contact fricked us real good
Agree 1000% Tig
Posted on 4/13/20 at 7:06 pm to LosLobos111
So obviously we know that Tuesday’s show big spikes in deaths from Monday, roughly around a 60% increase over the last 3 weeks, which is likely a result of delays in reporting from the Saturday-Monday, instead of a major increase of deaths Tuesdays.
That would put tomorrow’s totals at roughly 2300-2400; however, I suspect that given that: (1) there was a significant decrease over the last 3 days (1615 average) from the previous 3 days (1960 average), and (2) this was Easter weekend, that the under-reporting was even more significant than usual and Tuesday will show an even greater spike than usual.
So when if we assume it’s leveling at 1950-2000 right now, we’re potentially looking at potentially 2,755 to 3,155 reported deaths tomorrow, and a decrease back down to 1900-2000 for the rest of the week.
So I suspect that between tomorrow and Wednesday we’ll get a good idea if we’ve reached our peak. Anything less than 9,000 to 9,200 deaths over the last 4 days, will likely indicate that we’ve reached the peak.
That would put tomorrow’s totals at roughly 2300-2400; however, I suspect that given that: (1) there was a significant decrease over the last 3 days (1615 average) from the previous 3 days (1960 average), and (2) this was Easter weekend, that the under-reporting was even more significant than usual and Tuesday will show an even greater spike than usual.
So when if we assume it’s leveling at 1950-2000 right now, we’re potentially looking at potentially 2,755 to 3,155 reported deaths tomorrow, and a decrease back down to 1900-2000 for the rest of the week.
So I suspect that between tomorrow and Wednesday we’ll get a good idea if we’ve reached our peak. Anything less than 9,000 to 9,200 deaths over the last 4 days, will likely indicate that we’ve reached the peak.
This post was edited on 4/13/20 at 7:08 pm
Posted on 4/13/20 at 7:08 pm to Tiguar
quote:
that original cdc recommendation to not test without history of travel/known contact fricked us real good
Yeah they can't chant the mantra, "flatten the curve," as justification for the fricking, if they don't bother actually doing what it takes to draw a somewhat accurate curve.
This post was edited on 4/13/20 at 7:27 pm
Posted on 4/13/20 at 7:10 pm to LosLobos111
quote:Oddly enough the bleed over doesn’t show until Tuesday for whatever reason (based on the 60% increase on Tuesday over the last 3 weeks). With yesterday being Easter, I think we’ll see a more significant increase on Tuesday than usual, but WE SHOULD see a significant decrease over the course of the rest of the week as well.
1500 deaths at dinner time and that's probably with some bleed over from the weekend?
Posted on 4/13/20 at 7:19 pm to McLemore
Pretty low test volume as 3 hours ago.

Posted on 4/13/20 at 7:21 pm to uppermidwestbama
I find it interesting that the number of tests completed has been trending down the last few days. That will likely lead to fewer confirmed cases.
The first assumption that comes to my mind is that the severity of the disease is decreasing around the country.
The first assumption that comes to my mind is that the severity of the disease is decreasing around the country.
Posted on 4/13/20 at 7:28 pm to buckeye_vol
quote:
So when if we assume it’s leveling at 1950-2000 right now, we’re potentially looking at potentially 2,755 to 3,155 reported deaths tomorrow, and a decrease back down to 1900-2000 for the rest of the week
I agree that tomorrow will have more than today and Sunday, but there’s not going to be that many. Don’t think we get anywhere close to the high range of those numbers tomorrow.
I’d suspect more like 2,100
This post was edited on 4/13/20 at 7:30 pm
Posted on 4/13/20 at 7:41 pm to ValDawgsta
Barring a last-minute update, these are probably final numbers.
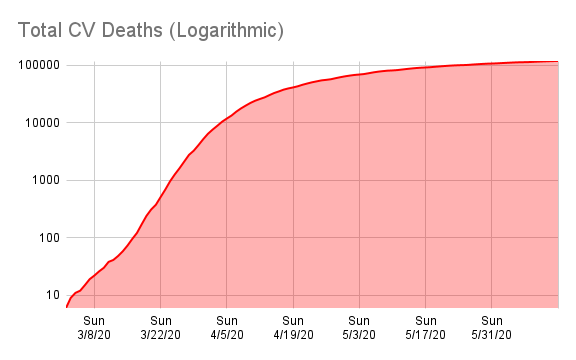
There are two graphs down towards the bottom of the page that I think show very well where we are and what direction it's headed.


I got the theory behind these graphs from this video someone linked earlier in the thread. https://www.youtube.com/watch?v=54XLXg4fYsc
In these graphs, you can clearly see the turn.
There are two graphs down towards the bottom of the page that I think show very well where we are and what direction it's headed.
I got the theory behind these graphs from this video someone linked earlier in the thread. https://www.youtube.com/watch?v=54XLXg4fYsc
In these graphs, you can clearly see the turn.
This post was edited on 4/13/20 at 7:42 pm
Posted on 4/13/20 at 7:50 pm to ValDawgsta
quote:The last 3 Tuesdays saw a daily increase in deaths totals from Monday of; 56.7%, 63.8%, and 58.5% for a 59.7% increase on average. These are likely due to a delay in reporting.
I agree that tomorrow will have more than today and Sunday, but there’s not going to be that many.
Using today’s 1516 total, that’s a total of 2420; however, given that this was a because this weekend’s totals resulted in a significant decrease from the end of last week, which was still increasing, albeit at a lower rate. I think that those combined with a holiday weekend, means it’s likely there is even a greater number deaths that will be delayed.
Therefore, I think 2420 is a lower bound and it will likely be much larger. But again, these are indicative of a sudden increase, just a delay in reporting. In fact, we could be slowing by
2% daily (13.2% weekly) since Friday’s peak (2035 deaths), and still see 2881 reported deaths on Tuesday with over 1,000 being a result of reporting delays from the previous 3 days.
Posted on 4/13/20 at 7:55 pm to ValDawgsta
Pretty big drop in new confirmed cases for the last 4 day average compared to the previous 4 day average (total of 8 days). Substantial drop in fact.
Posted on 4/13/20 at 8:14 pm to Chromdome35
This is the link to the US state level tracker that I have shared via Google Drive. Chromdome's State Level COVID-19 Daily Tracker
This is the link to the COVID-19 Country tracker that I have shared on Google Drive. Chromdome's COVID-19 Daily Tracker
On the state level tracker the states I have available right now are listed below. I will be adding additional states in the coming days.
Arkansas, Louisiana, New York, Georgia, Florida, California
The source for the data is https://www.worldometers.info/coronavirus/
The source for the testing data is from https://covidtracking.com/data/
On the tracker sheet you will see tabs for the following data:
1) US Summary
2) Country Comparables: This shows you how the US stacks up vs. select other countries dealing with COVID-19
3) Logarithmic Comparisons - Shows the US vs the other countries on the tracker.
4) Covid Vs Other Outbreaks - Compares the current COVID numbers to the last 10 years of flue and H1N1
5) US Weighted Averages - Explores 7 day vs 3 day weight average trends
6) Italy Summary
7) UK Summary
8) France Summary
9) Germany Summary
10) Sweden Summary
11) World Summary
NOTE: The daily growth rate data will not be accurate until the end of the day's postings. It will change throughout the day.
NOTE: I am not tracking individual states, I don't have a reliable consistent source for that data.
NOTE: I am not a mathematician, statistics guru, scientist, sharpest tack in the box, I'm just a guy who likes to understand for myself what is happening and to share it with others. This thread was not created to debate if you should or shouldn't take this seriously, it is simply to present the numbers and foster conversation.
NOTE: I have added a prediction number to the bottom of the data grid. This simply takes the previous days numbers and grows them at the previous day's growth rate. It should give the viewer some idea of what the numbers will look like today. Obviously, the final number for the day will be higher or lower based on what today's growth rate actualy is. This is just a simple indicator.






This is the link to the COVID-19 Country tracker that I have shared on Google Drive. Chromdome's COVID-19 Daily Tracker
On the state level tracker the states I have available right now are listed below. I will be adding additional states in the coming days.
Arkansas, Louisiana, New York, Georgia, Florida, California
The source for the data is https://www.worldometers.info/coronavirus/
The source for the testing data is from https://covidtracking.com/data/
On the tracker sheet you will see tabs for the following data:
1) US Summary
2) Country Comparables: This shows you how the US stacks up vs. select other countries dealing with COVID-19
3) Logarithmic Comparisons - Shows the US vs the other countries on the tracker.
4) Covid Vs Other Outbreaks - Compares the current COVID numbers to the last 10 years of flue and H1N1
5) US Weighted Averages - Explores 7 day vs 3 day weight average trends
6) Italy Summary
7) UK Summary
8) France Summary
9) Germany Summary
10) Sweden Summary
11) World Summary
NOTE: The daily growth rate data will not be accurate until the end of the day's postings. It will change throughout the day.
NOTE: I am not tracking individual states, I don't have a reliable consistent source for that data.
NOTE: I am not a mathematician, statistics guru, scientist, sharpest tack in the box, I'm just a guy who likes to understand for myself what is happening and to share it with others. This thread was not created to debate if you should or shouldn't take this seriously, it is simply to present the numbers and foster conversation.
NOTE: I have added a prediction number to the bottom of the data grid. This simply takes the previous days numbers and grows them at the previous day's growth rate. It should give the viewer some idea of what the numbers will look like today. Obviously, the final number for the day will be higher or lower based on what today's growth rate actualy is. This is just a simple indicator.
Posted on 4/13/20 at 8:15 pm to buckeye_vol
quote:
The last 3 Tuesdays saw a daily increase in deaths totals from Monday of; 56.7%, 63.8%, and 58.5% for a 59.7% increase on average. These are likely due to a delay in reporting.
Totally agree on that point. My only quibble is that you think there will be a similar disparity tomorrow. I’m arguing the jump will exist, but be more muted if we have in fact hit the peak. Obviously I don’t know that, but most models think we have.
If the previous Tuesday’s we were still on the upswing of the curve that meant there was an additional 2 days of traveling up the curve in addition to the delayed reporting.
I’m guessing tomorrow we will have had an additional 2 days of going DOWN the curve. Now I admit numbers will be higher than today/Sunday because of the lag you mentioned.
Seriously seriously doubt we get to 2500 as you suggest. We shall see though.
Posted on 4/13/20 at 8:20 pm to ValDawgsta
I think we'll get to about 1900-2000 deaths tomorrow IF we see a weekend hangover like we have been seeing.
Posted on 4/13/20 at 8:25 pm to Chromdome35
The number of new cases continued to decline, the 4th day in a row. The number of new deaths remained flat to yesterday; however, the days to double for deaths will cross into the 7's tomorrow.
Mortality has crossed into 4% territory, how much of this mortality has been due to cases from senior living centers?
Tests were down today to 119K, 20K below the normal 138K. The % of positive tests remained steady at 20.8% for the day with a cumulative total of 19.7%.
Mortality has crossed into 4% territory, how much of this mortality has been due to cases from senior living centers?
Tests were down today to 119K, 20K below the normal 138K. The % of positive tests remained steady at 20.8% for the day with a cumulative total of 19.7%.
Posted on 4/13/20 at 8:26 pm to ValDawgsta
No way will we hit 2,500 deaths. The ICU data does NOT support such a number.

 Page 169 of 331



Popular

Back to top
 Follow TigerDroppings for LSU Football News