




 0
0








- My Forums
- Tiger Rant
- LSU Score Board
- LSU Recruiting
- SEC Rant
- SEC Score Board
- Saints Talk
- Pelicans Talk
- More Sports Board
- Fantasy Sports
- Golf Board
- Soccer Board
- O-T Lounge
- Tech Board
- Home/Garden Board
- Outdoor Board
- Health/Fitness Board
- Movie/TV Board
- Book Board
- Music Board
- Political Talk
- Money Talk
- Fark Board
- Gaming Board
- Travel Board
- Food/Drink Board
- Ticket Exchange
- TD Help Board
Customize My Forums- View All Forums
- Show Left Links
- Topic Sort Options
- Trending Topics
- Recent Topics
- Active Topics
Started By
Message
re: Daily COVID Updated as of 11/2/20 8:00 PM
Posted on 4/13/20 at 12:26 pm to Chromdome35
Posted on 4/13/20 at 12:26 pm to Chromdome35
After reaching out for help in the help forum, the board mgmt did something so that my original post would continue to show the graphics.
HUGE shout out and thank you to the board admins.
HUGE shout out and thank you to the board admins.
Posted on 4/13/20 at 12:45 pm to Chromdome35
quote:


Posted on 4/13/20 at 12:53 pm to Winston Cup
Winston, because of the testing constraint and it's impact on the daily growth rate % you really should be looking at the number of new cases by day which shows the real decline.

Posted on 4/13/20 at 1:46 pm to Chromdome35
Relatively good numbers for New Jersey today.
Posted on 4/13/20 at 2:56 pm to Chromdome35
The IHME model was updated again as of yesterday.
Shows the new peak today with 2150 Deaths
Shows the new peak today with 2150 Deaths
Posted on 4/13/20 at 2:58 pm to Chromdome35
quote:
Shows the new peak today with 2150 Deaths
I'm not sure I'm buying what theyre selling but maybe I guess
Posted on 4/13/20 at 2:59 pm to Tiguar
Yea, me either.
Posted on 4/13/20 at 3:02 pm to Tiguar
They’re assuming nice bell graphs even in places with small data sets. Missouri, for instance, is projected to have 51 deaths/day on its peak day. Because a nice slope isn’t really materializing, the time to peak keeps being pushed out into the future. 2 deaths on March 31st, 11 on April 5th, 21 on April 8th and 6 on April 10th.
On the last update, Missouri’s peak was this week. Now it’s projected to April 28th.
On the last update, Missouri’s peak was this week. Now it’s projected to April 28th.
This post was edited on 4/13/20 at 3:04 pm
Posted on 4/13/20 at 3:02 pm to Chromdome35
It looks like to me that this thing is starting to round off and start declining.
Posted on 4/13/20 at 3:05 pm to the808bass
yeah I noticed it pushed out the peaks for everyone but I still doubt over 2k die today, jmo. could be wrong
Posted on 4/13/20 at 3:08 pm to Tiguar
New York would have to double and a couple others would have to have high death totals.
Posted on 4/13/20 at 4:00 pm to Chromdome35
This is the link to the US state level tracker that I have shared via Google Drive. Chromdome's State Level COVID-19 Daily Tracker
This is the link to the COVID-19 Country tracker that I have shared on Google Drive. Chromdome's COVID-19 Daily Tracker
On the state level tracker the states I have available right now are listed below. I will be adding additional states in the coming days.
Arkansas, Louisiana, New York, Georgia, Florida, California
The source for the data is https://www.worldometers.info/coronavirus/
The source for the testing data is from https://covidtracking.com/data/
On the tracker sheet you will see tabs for the following data:
1) US Summary
2) Country Comparables: This shows you how the US stacks up vs. select other countries dealing with COVID-19
3) Logarithmic Comparisons - Shows the US vs the other countries on the tracker.
4) Covid Vs Other Outbreaks - Compares the current COVID numbers to the last 10 years of flue and H1N1
5) US Weighted Averages - Explores 7 day vs 3 day weight average trends
6) Italy Summary
7) UK Summary
8) France Summary
9) Germany Summary
10) Sweden Summary
11) World Summary
NOTE: The daily growth rate data will not be accurate until the end of the day's postings. It will change throughout the day.
NOTE: I am not tracking individual states, I don't have a reliable consistent source for that data.
NOTE: I am not a mathematician, statistics guru, scientist, sharpest tack in the box, I'm just a guy who likes to understand for myself what is happening and to share it with others. This thread was not created to debate if you should or shouldn't take this seriously, it is simply to present the numbers and foster conversation.
NOTE: I have added a prediction number to the bottom of the data grid. This simply takes the previous days numbers and grows them at the previous day's growth rate. It should give the viewer some idea of what the numbers will look like today. Obviously, the final number for the day will be higher or lower based on what today's growth rate actualy is. This is just a simple indicator.


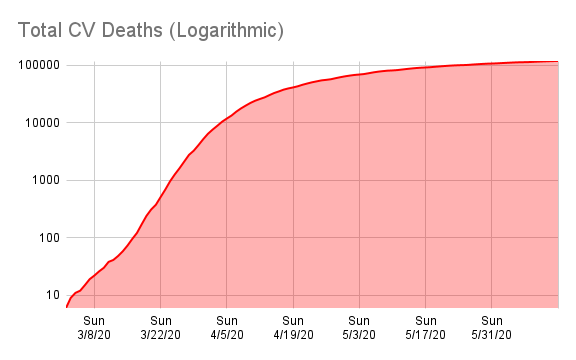


This is the link to the COVID-19 Country tracker that I have shared on Google Drive. Chromdome's COVID-19 Daily Tracker
On the state level tracker the states I have available right now are listed below. I will be adding additional states in the coming days.
Arkansas, Louisiana, New York, Georgia, Florida, California
The source for the data is https://www.worldometers.info/coronavirus/
The source for the testing data is from https://covidtracking.com/data/
On the tracker sheet you will see tabs for the following data:
1) US Summary
2) Country Comparables: This shows you how the US stacks up vs. select other countries dealing with COVID-19
3) Logarithmic Comparisons - Shows the US vs the other countries on the tracker.
4) Covid Vs Other Outbreaks - Compares the current COVID numbers to the last 10 years of flue and H1N1
5) US Weighted Averages - Explores 7 day vs 3 day weight average trends
6) Italy Summary
7) UK Summary
8) France Summary
9) Germany Summary
10) Sweden Summary
11) World Summary
NOTE: The daily growth rate data will not be accurate until the end of the day's postings. It will change throughout the day.
NOTE: I am not tracking individual states, I don't have a reliable consistent source for that data.
NOTE: I am not a mathematician, statistics guru, scientist, sharpest tack in the box, I'm just a guy who likes to understand for myself what is happening and to share it with others. This thread was not created to debate if you should or shouldn't take this seriously, it is simply to present the numbers and foster conversation.
NOTE: I have added a prediction number to the bottom of the data grid. This simply takes the previous days numbers and grows them at the previous day's growth rate. It should give the viewer some idea of what the numbers will look like today. Obviously, the final number for the day will be higher or lower based on what today's growth rate actualy is. This is just a simple indicator.
Posted on 4/13/20 at 4:09 pm to Chromdome35
I like those trends.
Posted on 4/13/20 at 4:10 pm to Chromdome35
Peak day of deaths will stay 4/10/2020.
Posted on 4/13/20 at 4:12 pm to Chromdome35
Just keep posting good numbers please.
Posted on 4/13/20 at 4:13 pm to JakeMik
So it appears deaths are going down. Is it a factor of many people getting tested positive that are mostly mild cases or are the Trump drugs working?
I know the plasma treatment will work as the eventual treatment.
I know the plasma treatment will work as the eventual treatment.
Posted on 4/13/20 at 4:36 pm to uppermidwestbama
I'm willing to put weight into the theory we are getting better at detecting then treating this and treating it sooner.
This post was edited on 4/13/20 at 4:37 pm
Posted on 4/13/20 at 4:37 pm to Tiguar
Speculation: with more people more isolated, viral load may be lower for positive cases leading to easier recoveries?
Posted on 4/13/20 at 4:38 pm to the808bass
maybe
I think there is a strong correlation to early detection and initiation of therapy with positive outcomes
everyone knows to go get swabbed if they feel like shite and docs are less skiddish of prescribing hcq early.
couple that with less viral load and you get less mortality
I think there is a strong correlation to early detection and initiation of therapy with positive outcomes
everyone knows to go get swabbed if they feel like shite and docs are less skiddish of prescribing hcq early.
couple that with less viral load and you get less mortality
Posted on 4/13/20 at 4:45 pm to Tiguar
You may have been making the same point.
But when we were relying on a reason for testing (travel, known contact with someone infected), we were delaying testing. Once the criteria for testing changed to community spread, it was easier to identify cases earlier as well.
That’s probably tied to the CDC screw up with a lack of tests available early on.
But when we were relying on a reason for testing (travel, known contact with someone infected), we were delaying testing. Once the criteria for testing changed to community spread, it was easier to identify cases earlier as well.
That’s probably tied to the CDC screw up with a lack of tests available early on.

 Page 168 of 331



Popular

Back to top
 Follow TigerDroppings for LSU Football News