




 0
0










- My Forums
- Tiger Rant
- LSU Recruiting
- SEC Rant
- Saints Talk
- Pelicans Talk
- More Sports Board
- Fantasy Sports
- Golf Board
- Soccer Board
- O-T Lounge
- Tech Board
- Home/Garden Board
- Outdoor Board
- Health/Fitness Board
- Movie/TV Board
- Book Board
- Music Board
- Political Talk
- Money Talk
- Fark Board
- Gaming Board
- Travel Board
- Food/Drink Board
- Ticket Exchange
- TD Help Board
Customize My Forums- View All Forums
- Show Left Links
- Topic Sort Options
- Trending Topics
- Recent Topics
- Active Topics
Started By
Message
Posted on 4/7/20 at 7:54 am to BamaChemE
I would be honored. When this is over I will be happy to share the sheets and data with you.
Posted on 4/7/20 at 8:22 am to Chromdome35
What is the function formula used in the Total Cases Day to Double data? It's skewing the data in the chart and corresponding graph.
I would suggest you apply a formula change so that it always reflects the last, correct cell, or the last whole number immediately after the last correct cell.
Glad to help if you need it.
I would suggest you apply a formula change so that it always reflects the last, correct cell, or the last whole number immediately after the last correct cell.
Glad to help if you need it.
Posted on 4/7/20 at 8:25 am to HubbaBubba
65 deaths reported in Georgia this morning. That seems like a lot. Hoping we can stay under 1,800 today for the entire country.
Posted on 4/7/20 at 8:26 am to Chromdome35
This is the link to the COVID-19 Country tracker that I have shared on Google Drive. Chromdome's COVID-19 Daily Tracker
This is the link to the US state level tracker that I have shared via Google Drive. Chromdome's State Level COVID-19 Daily Tracker
On the state level tracker the states I have available right now are listed below. I will be adding additional states in the coming days.
Arkansas, Louisiana, New York, Georgia, Florida, California
The source for the data is https://www.worldometers.info/coronavirus/
The source for the testing data is from https://covidtracking.com/data/
On the tracker sheet you will see tabs for the following data:
1) US Summary
2) Country Comparables: This shows you how the US stacks up vs. select other countries dealing with COVID-19
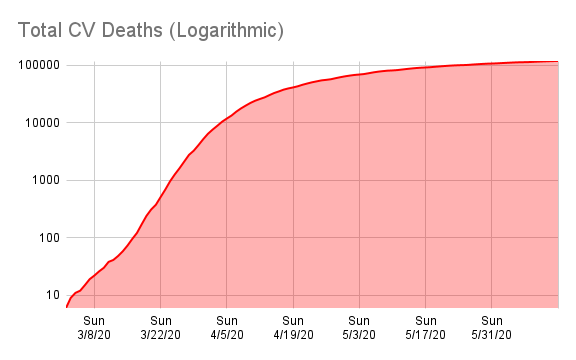
3) Logarithmic Comparisons - Shows the US vs the other countries on the tracker.
4) Covid Vs Other Outbreaks - Compares the current COVID numbers to the last 10 years of flue and H1N1
5) US Weighted Averages - Explores 7 day vs 3 day weight average trends
6) Italy Summary
7) UK Summary
8) France Summary
9) Germany Summary
10) Sweden Summary
11) World Summary
NOTE: The daily growth rate data will not be accurate until the end of the day's postings. It will change throughout the day.
NOTE: I am not tracking individual states, I don't have a reliable consistent source for that data.
NOTE: I am not a mathematician, statistics guru, scientist, sharpest tack in the box, I'm just a guy who likes to understand for myself what is happening and to share it with others. This thread was not created to debate if you should or shouldn't take this seriously, it is simply to present the numbers and foster conversation.
NOTE: I have added a prediction number to the bottom of the data grid. This simply takes the previous days numbers and grows them at the previous day's growth rate. It should give the viewer some idea of what the numbers will look like today. Obviously, the final number for the day will be higher or lower based on what today's growth rate actualy is. This is just a simple indicator.






This is the link to the US state level tracker that I have shared via Google Drive. Chromdome's State Level COVID-19 Daily Tracker
On the state level tracker the states I have available right now are listed below. I will be adding additional states in the coming days.
Arkansas, Louisiana, New York, Georgia, Florida, California
The source for the data is https://www.worldometers.info/coronavirus/
The source for the testing data is from https://covidtracking.com/data/
On the tracker sheet you will see tabs for the following data:
1) US Summary
2) Country Comparables: This shows you how the US stacks up vs. select other countries dealing with COVID-19
3) Logarithmic Comparisons - Shows the US vs the other countries on the tracker.
4) Covid Vs Other Outbreaks - Compares the current COVID numbers to the last 10 years of flue and H1N1
5) US Weighted Averages - Explores 7 day vs 3 day weight average trends
6) Italy Summary
7) UK Summary
8) France Summary
9) Germany Summary
10) Sweden Summary
11) World Summary
NOTE: The daily growth rate data will not be accurate until the end of the day's postings. It will change throughout the day.
NOTE: I am not tracking individual states, I don't have a reliable consistent source for that data.
NOTE: I am not a mathematician, statistics guru, scientist, sharpest tack in the box, I'm just a guy who likes to understand for myself what is happening and to share it with others. This thread was not created to debate if you should or shouldn't take this seriously, it is simply to present the numbers and foster conversation.
NOTE: I have added a prediction number to the bottom of the data grid. This simply takes the previous days numbers and grows them at the previous day's growth rate. It should give the viewer some idea of what the numbers will look like today. Obviously, the final number for the day will be higher or lower based on what today's growth rate actualy is. This is just a simple indicator.
Posted on 4/7/20 at 8:32 am to HubbaBubba
Not sure I'm following you.
The Days to double calculations/formulas look at a days total Cases or deaths, then looks for the day when that number is doubled. So in the case of Monday 3/30/20 we had 163,788 cases. Double that would be 327,576. The formula looks for the first date with more than 327,576 and then calculates the number of days difference yielding the days to double rate.
Since that yields an integer result, I then interpolate the fractional component by looking at the difference in cases between the doubled date and the day before it, breaking that down into an hourly rate, then calculating how many hours at that rate would have been necessary to reach the actual doubling threshold. I take those hours and divide by 24 Hours to get a decimal representation of the fractional days. I add that to the integer in the first part of the calculation to get the final result.
If a day isn't showing a days to double rate yet, that's because it hasn't doubled yet.
My days to double calculation is an after the fact calculation, I'm not projecting what it will be as the inconsistency of the data makes any prediction calculation problematic.
The Days to double calculations/formulas look at a days total Cases or deaths, then looks for the day when that number is doubled. So in the case of Monday 3/30/20 we had 163,788 cases. Double that would be 327,576. The formula looks for the first date with more than 327,576 and then calculates the number of days difference yielding the days to double rate.
Since that yields an integer result, I then interpolate the fractional component by looking at the difference in cases between the doubled date and the day before it, breaking that down into an hourly rate, then calculating how many hours at that rate would have been necessary to reach the actual doubling threshold. I take those hours and divide by 24 Hours to get a decimal representation of the fractional days. I add that to the integer in the first part of the calculation to get the final result.
If a day isn't showing a days to double rate yet, that's because it hasn't doubled yet.
My days to double calculation is an after the fact calculation, I'm not projecting what it will be as the inconsistency of the data makes any prediction calculation problematic.
This post was edited on 4/7/20 at 10:09 am
Posted on 4/7/20 at 8:37 am to BamaChemE
quote:
I'm an engineering professor, and I wanted to ask permission to share some of the data with students to help teach data analytics/modeling.
You and CD should co-write a paper on this, purely on the statistical analysis side of it. "Publish or perish", right? I mean, he's done the hard work. All you have to do is format it and fill in all the professor talk.
Posted on 4/7/20 at 8:42 am to Ace Midnight
My "analysis" is very simple. I'm pretty much just cataloging the numbers and drawing some graphs from it, there isn't real analysis going on here.
I'm willing to share this with anyone who wants the data I've compiled. After it's over (hopefully soon) I will share all of it with anyone who wants it.
I'm willing to share this with anyone who wants the data I've compiled. After it's over (hopefully soon) I will share all of it with anyone who wants it.
Posted on 4/7/20 at 9:15 am to Eat Your Crow
Hi in Louisiana so far is 68 two days ago.
Posted on 4/7/20 at 9:18 am to tiger91
Alright guys and gals, today is the big day we see if we’ve truly turned the corner.
Our posting here doesn’t really do anything but let’s get some positive vibes going
Our posting here doesn’t really do anything but let’s get some positive vibes going
Posted on 4/7/20 at 9:24 am to Chromdome35
quote:
My "analysis" is very simple.
quote:

USA 0
China Flu 0
with the USA in scoring position
the only stat that matters
Posted on 4/7/20 at 10:07 am to Winston Cup
Big day today LFG!!

Posted on 4/7/20 at 10:14 am to buckeye_vol
These were the projected deaths for NYC
4/7 3081
4/8 3415
4/9 3762
4/10 4121
4/11 4490
Well, this mornings report has it at 3,202 for the day so far. 727 deaths.
That isn't a surprise. I stated many times there would be a lot of death in NYC this week.
4/7 3081
4/8 3415
4/9 3762
4/10 4121
4/11 4490
Well, this mornings report has it at 3,202 for the day so far. 727 deaths.
That isn't a surprise. I stated many times there would be a lot of death in NYC this week.
Posted on 4/7/20 at 10:15 am to uppermidwestbama
Big jump up in deaths for NY in the morning update.
Posted on 4/7/20 at 10:28 am to Eat Your Crow
quote:The Georgia Dept of Health says that some of that number is from new labs reporting numbers. We will see in the coming days. They might be trying to downplay things.
65 deaths reported in Georgia this morning. That seems like a lot. Hoping we can stay under 1,800 today for the entire country.
Posted on 4/7/20 at 10:36 am to Chromdome35
It is absolutely outstanding work and a very good service to the TD community.
You should have a TD t-shirt, koozie, premium membership, get out of banland for free card ect.!!!!
One thing I noticed on the world meter link you have is the number of tests per 1m people stat by state.
Louisiana has tested more people per capita than any other state except New York.
That is a good sign.
You should have a TD t-shirt, koozie, premium membership, get out of banland for free card ect.!!!!
One thing I noticed on the world meter link you have is the number of tests per 1m people stat by state.
Louisiana has tested more people per capita than any other state except New York.
That is a good sign.
This post was edited on 4/7/20 at 10:39 am
Posted on 4/7/20 at 11:08 am to Tiguar
quote:
Our posting here doesn’t really do anything but let’s get some positive vibes goin
How are your patients doing? How many on vents? Any with potential to come off??
Posted on 4/7/20 at 11:12 am to Chromdome35
I’d say that’s to be expected. Deaths lag cases by a week or two and cases were obviously growing during that time frame. If they go down or stay relatively flat, then I’d think that probably means we have good medical intervention in place.
This post was edited on 4/7/20 at 11:14 am
Posted on 4/7/20 at 11:18 am to Ingloriousbastard
Already over 1,000 deaths for the day, BUT New York has already reported and their count was only 731.
731 is only slightly higher than their total yesterday, and I don't THINK they will add much more for the day.
I still think anything under 1,800 is a BIG win for today. That would be well under what the models have for 4/7/20.
731 is only slightly higher than their total yesterday, and I don't THINK they will add much more for the day.
I still think anything under 1,800 is a BIG win for today. That would be well under what the models have for 4/7/20.
Posted on 4/7/20 at 11:19 am to Eat Your Crow

 Page 144 of 331



Popular

Back to top
 Follow TigerDroppings for LSU Football News