




 0
0




- My Forums
- Tiger Rant
- LSU Recruiting
- SEC Rant
- Saints Talk
- Pelicans Talk
- More Sports Board
- Fantasy Sports
- Golf Board
- Soccer Board
- O-T Lounge
- Tech Board
- Home/Garden Board
- Outdoor Board
- Health/Fitness Board
- Movie/TV Board
- Book Board
- Music Board
- Political Talk
- Money Talk
- Fark Board
- Gaming Board
- Travel Board
- Food/Drink Board
- Ticket Exchange
- TD Help Board
Customize My Forums- View All Forums
- Show Left Links
- Topic Sort Options
- Trending Topics
- Recent Topics
- Active Topics
Started By
Message
re: Daily COVID Updated as of 11/2/20 8:00 PM
Posted on 4/6/20 at 8:09 pm to buckeye_vol
Posted on 4/6/20 at 8:09 pm to buckeye_vol
quote:
but anything cost 1,800 would indicate we still have a week or more to go. Anything in between will be more inconclusive.
I think it'll be closer to 1,800, but I don't mean that as some sort of doomsday prediction. I just think we have about a week left until we peak in terms of deaths.
ETA: Hope I'm wrong
This post was edited on 4/6/20 at 8:11 pm
Posted on 4/6/20 at 8:13 pm to Chromdome35
Btw NY did update tonight.
I am getting ready to watch the final episode of tiger king with my wife. I will make the final update in an hour or so.
I am getting ready to watch the final episode of tiger king with my wife. I will make the final update in an hour or so.
Posted on 4/6/20 at 8:15 pm to Chromdome35
Worldometers has flipped the clock to tomorrow with only 1,255 deaths.
This post was edited on 4/6/20 at 8:27 pm
Posted on 4/6/20 at 8:33 pm to uppermidwestbama
quote:Except the data don’t support this. The growth rate of tests has slowed. So if this were completely true, then the percentage of positive results would either be unchanged or (even better) lower. Instead it’s gone from about 15% positive tests just 2 weeks ago to approaching 21% over the last week (and increasing) with some time remaining tonight.
What we are already seeing is simple - fewer people are getting ill enough with COVID19 where testing is needed.
That equates to 51,300 more tests per day over the last week to have a comparable percentage to confidently say that the slowing is due solely to a slowing of positive cases not a slowing of testing.
And multiple states have reported as much as states like New York have decided to only test the more severe cases (where they had lines of people before) and in Ohio the universities/non-profits have just created new tests (not yet scaled for mass testing) after the whole CDC/FDA botched approval process and the private labs getting backlogged.
In other words, while I do think cases are slowing, I think we’re also missing a considerable amount of true cases as a result of a slowing in testing. So it’s still positive overall, but more of a mixed-bag than it would appear at first.
Posted on 4/6/20 at 8:39 pm to Eat Your Crow
The BIG news of the day is that we have now gone two days in a row with the confirmed case growth rate hitting the single digits.
That means in the coming days the death numbers will decrease (not this week).
That means fewer cases are likely to be confirmed on a daily basis moving forward. There will always be some days that are higher and lower, but the trend of a decrease in cases is now starting to show a trend. We will know by the end of the week if it ended up being a true trend. If it does, this is almost over.
That means in the coming days the death numbers will decrease (not this week).
That means fewer cases are likely to be confirmed on a daily basis moving forward. There will always be some days that are higher and lower, but the trend of a decrease in cases is now starting to show a trend. We will know by the end of the week if it ended up being a true trend. If it does, this is almost over.
This post was edited on 4/6/20 at 8:40 pm
Posted on 4/6/20 at 8:42 pm to uppermidwestbama
No issue in San Diego

Posted on 4/6/20 at 8:44 pm to uppermidwestbama
quote:I don’t think I’ve ever seen a graph with the log-base of 5 as an axis.
No issue in San Diego
Posted on 4/6/20 at 8:59 pm to Chromdome35
quote:
The testing numbers are in my data you have to look at the tracker at the link in my status posts.
Thanks!
Posted on 4/6/20 at 9:01 pm to Chromdome35
This is the link to the COVID-19 Country tracker that I have shared on Google Drive. Chromdome's COVID-19 Daily Tracker
This is the link to the US state level tracker that I have shared via Google Drive. Chromdome's State Level COVID-19 Daily Tracker
On the state level tracker the states I have available right now are listed below. I will be adding additional states in the coming days.
Arkansas, Louisiana, New York, Georgia, Florida, California
The source for the data is https://www.worldometers.info/coronavirus/
The source for the testing data is from https://covidtracking.com/data/
On the tracker sheet you will see tabs for the following data:
1) US Summary
2) Country Comparables: This shows you how the US stacks up vs. select other countries dealing with COVID-19
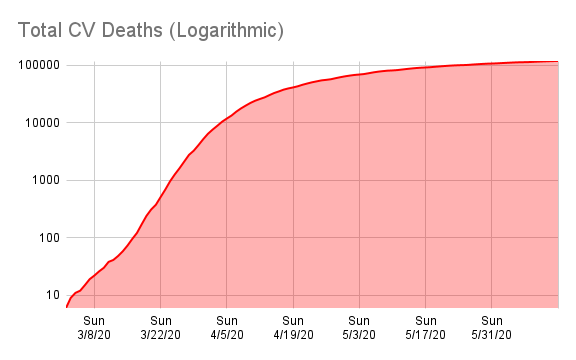
3) Logarithmic Comparisons - Shows the US vs the other countries on the tracker.
4) Covid Vs Other Outbreaks - Compares the current COVID numbers to the last 10 years of flue and H1N1
5) US Weighted Averages - Explores 7 day vs 3 day weight average trends
6) Italy Summary
7) UK Summary
8) France Summary
9) Germany Summary
10) Sweden Summary
11) World Summary
NOTE: The daily growth rate data will not be accurate until the end of the day's postings. It will change throughout the day.
NOTE: I am not tracking individual states, I don't have a reliable consistent source for that data.
NOTE: I am not a mathematician, statistics guru, scientist, sharpest tack in the box, I'm just a guy who likes to understand for myself what is happening and to share it with others. This thread was not created to debate if you should or shouldn't take this seriously, it is simply to present the numbers and foster conversation.
NOTE: I have added a prediction number to the bottom of the data grid. This simply takes the previous days numbers and grows them at the previous day's growth rate. It should give the viewer some idea of what the numbers will look like today. Obviously, the final number for the day will be higher or lower based on what today's growth rate actualy is. This is just a simple indicator.






This is the link to the US state level tracker that I have shared via Google Drive. Chromdome's State Level COVID-19 Daily Tracker
On the state level tracker the states I have available right now are listed below. I will be adding additional states in the coming days.
Arkansas, Louisiana, New York, Georgia, Florida, California
The source for the data is https://www.worldometers.info/coronavirus/
The source for the testing data is from https://covidtracking.com/data/
On the tracker sheet you will see tabs for the following data:
1) US Summary
2) Country Comparables: This shows you how the US stacks up vs. select other countries dealing with COVID-19
3) Logarithmic Comparisons - Shows the US vs the other countries on the tracker.
4) Covid Vs Other Outbreaks - Compares the current COVID numbers to the last 10 years of flue and H1N1
5) US Weighted Averages - Explores 7 day vs 3 day weight average trends
6) Italy Summary
7) UK Summary
8) France Summary
9) Germany Summary
10) Sweden Summary
11) World Summary
NOTE: The daily growth rate data will not be accurate until the end of the day's postings. It will change throughout the day.
NOTE: I am not tracking individual states, I don't have a reliable consistent source for that data.
NOTE: I am not a mathematician, statistics guru, scientist, sharpest tack in the box, I'm just a guy who likes to understand for myself what is happening and to share it with others. This thread was not created to debate if you should or shouldn't take this seriously, it is simply to present the numbers and foster conversation.
NOTE: I have added a prediction number to the bottom of the data grid. This simply takes the previous days numbers and grows them at the previous day's growth rate. It should give the viewer some idea of what the numbers will look like today. Obviously, the final number for the day will be higher or lower based on what today's growth rate actualy is. This is just a simple indicator.
Posted on 4/6/20 at 9:06 pm to uppermidwestbama
Tomorrow I predict we see another good decrease in confirmed cases. Lot's of labs are now having results back within 48 hours instead of a week or longer.
And now with Abbott and that 45-minute test the data is basically in real-time, just a delay in reporting at the state level.
By the end of the week we will see the line going south.
The death line will go up, the case line will go down.
And now with Abbott and that 45-minute test the data is basically in real-time, just a delay in reporting at the state level.
By the end of the week we will see the line going south.
The death line will go up, the case line will go down.
Posted on 4/6/20 at 9:08 pm to uppermidwestbama
164 new cases of COVID-19 in King County WA today. 7-day average 145. Has been in 108-166 range since 3/24.
3,331 total cases. Daily growth rate 5.2% during last week. Total doubles in 13.6 days.
It's almost over at the county where this all started.
3,331 total cases. Daily growth rate 5.2% during last week. Total doubles in 13.6 days.
It's almost over at the county where this all started.
Posted on 4/6/20 at 9:08 pm to Chromdome35
Tomorrow the # of cases days to double will hit 7 and the number of deaths days to double will be in the high fives, and possibly 6. Both of those are good numbers to see.
Mortality will probably breach 3% tomorrow.
155K tests today, 2nd highest ever and a 17K improvement over yesterday.
The inconsistency of the weekend data makes it very difficult to trust the early week data. Tomorrows, maybe Wednesday's numbers should tell us if it's real or not.
Mortality will probably breach 3% tomorrow.
155K tests today, 2nd highest ever and a 17K improvement over yesterday.
The inconsistency of the weekend data makes it very difficult to trust the early week data. Tomorrows, maybe Wednesday's numbers should tell us if it's real or not.
Posted on 4/6/20 at 9:10 pm to uppermidwestbama
quote:Then we should not be seeing an increase in positive test percentages, and we need to see an acceleration when a test can add 30 to 40 percent more tests to the market in a daily basis.
Tomorrow I predict we see another good decrease in confirmed cases. Lot's of labs are now having results back within 48 hours instead of a week or longer.
Posted on 4/6/20 at 9:45 pm to uppermidwestbama
quote:
It's almost over at the county where this all started.
Well that is some very good news!
Posted on 4/6/20 at 10:07 pm to Chromdome35
Sure hope we can continue to decrease the death figures. We’re climbing the leaderboard quickly in deaths per capita and not in a good way.
Posted on 4/6/20 at 10:52 pm to uppermidwestbama
quote:
164 new cases of COVID-19 in King County WA today. 7-day average 145. Has been in 108-166 range since 3/24.
3,331 total cases. Daily growth rate 5.2% during last week. Total doubles in 13.6 days.
It's almost over at the county where this all started.
Inslee will probably try to keep us locked down through July though...
Posted on 4/7/20 at 6:54 am to buckeye_vol
quote:
I don’t think I’ve ever seen a graph with the log-base of 5 as an axis.
I will keep riding with Chromedome.
If you have not clicked on his google.docs, give it a try. I find them to be a great source.
Posted on 4/7/20 at 7:23 am to Chromdome35
This is really great work! Thanks for compiling all of this!
I'm an engineering professor, and I wanted to ask permission to share some of the data with students to help teach data analytics/modeling. I figure that this will have a lasting enough impact that after this wraps up I could still use it as a teaching tool for another few years...
I'm an engineering professor, and I wanted to ask permission to share some of the data with students to help teach data analytics/modeling. I figure that this will have a lasting enough impact that after this wraps up I could still use it as a teaching tool for another few years...

 Page 143 of 331



Popular

Back to top
 Follow TigerDroppings for LSU Football News