




 2
2




- My Forums
- Tiger Rant
- LSU Recruiting
- SEC Rant
- Saints Talk
- Pelicans Talk
- More Sports Board
- Fantasy Sports
- Golf Board
- Soccer Board
- O-T Lounge
- Tech Board
- Home/Garden Board
- Outdoor Board
- Health/Fitness Board
- Movie/TV Board
- Book Board
- Music Board
- Political Talk
- Money Talk
- Fark Board
- Gaming Board
- Travel Board
- Food/Drink Board
- Ticket Exchange
- TD Help Board
Customize My Forums- View All Forums
- Show Left Links
- Topic Sort Options
- Trending Topics
- Recent Topics
- Active Topics
Started By
Message
Posted on 4/6/20 at 6:44 am to AMS
quote:
Actual quantitative viral exposure is a factor in severity of the infection.
Of all the stuff I've read and pondered and analyzed, I honestly haven't thought much about viral load.
Here's an article on it New York Mag
quote:
If there’s one virus on a doorknob, you’re much less likely to get sick from touching the doorknob than if there’s 1,000 viruses on that doorknob. With a bigger exposure, some of the viruses are more likely to actually get into your airway and find a place to replicate. If you’re exposed to no virus at all, you’re not going to get sick. If you’re exposed to one little viral particle, you probably have a much lower chance of becoming infected than if you are right next to someone on an airplane who is coughing for eight hours. The amount of virus needed to cause an infection is the infectious dose, which is different than the viral load.
I quoted the wrong part. Goes on to talk about severity.
This post was edited on 4/6/20 at 6:45 am
Posted on 4/6/20 at 8:07 am to AMS
quote:
Actual quantitative viral exposure is a factor in severity of the infection. NY being much closer quarters likely means larger ‘doses’ of virus.
being a less densely packed is a form of Social distancing With/without other specific behavior modifications.
More folks densely packed shedding higher loads is partially why it hits regions like wuhan, ny, and ital with greater severity.
Miami is a top 50 metro area in the world, Italy, particularly northern Italy doesnt make the top 100.
Posted on 4/6/20 at 8:36 am to Chromdome35
This is the link to the COVID-19 Country tracker that I have shared on Google Drive. Chromdome's COVID-19 Daily Tracker
This is the link to the US state level tracker that I have shared via Google Drive. Chromdome's State Level COVID-19 Daily Tracker
On the state level tracker the states I have available right now are listed below. I will be adding additional states in the coming days.
Arkansas, Louisiana, New York, Georgia, Florida, California
The source for the data is https://www.worldometers.info/coronavirus/
The source for the testing data is from https://covidtracking.com/data/
On the tracker sheet you will see tabs for the following data:
1) US Summary
2) Country Comparables: This shows you how the US stacks up vs. select other countries dealing with COVID-19
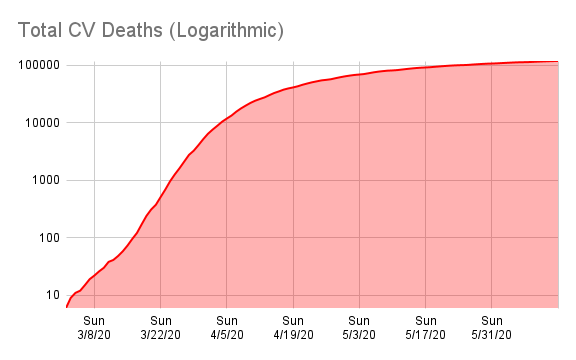
3) Logarithmic Comparisons - Shows the US vs the other countries on the tracker.
4) Covid Vs Other Outbreaks - Compares the current COVID numbers to the last 10 years of flue and H1N1
5) US Weighted Averages - Explores 7 day vs 3 day weight average trends
6) Italy Summary
7) UK Summary
8) France Summary
9) Germany Summary
10) Sweden Summary
11) World Summary
NOTE: The daily growth rate data will not be accurate until the end of the day's postings. It will change throughout the day.
NOTE: I am not tracking individual states, I don't have a reliable consistent source for that data.
NOTE: I am not a mathematician, statistics guru, scientist, sharpest tack in the box, I'm just a guy who likes to understand for myself what is happening and to share it with others. This thread was not created to debate if you should or shouldn't take this seriously, it is simply to present the numbers and foster conversation.
NOTE: I have added a prediction number to the bottom of the data grid. This simply takes the previous days numbers and grows them at the previous day's growth rate. It should give the viewer some idea of what the numbers will look like today. Obviously, the final number for the day will be higher or lower based on what today's growth rate actualy is. This is just a simple indicator.






This is the link to the US state level tracker that I have shared via Google Drive. Chromdome's State Level COVID-19 Daily Tracker
On the state level tracker the states I have available right now are listed below. I will be adding additional states in the coming days.
Arkansas, Louisiana, New York, Georgia, Florida, California
The source for the data is https://www.worldometers.info/coronavirus/
The source for the testing data is from https://covidtracking.com/data/
On the tracker sheet you will see tabs for the following data:
1) US Summary
2) Country Comparables: This shows you how the US stacks up vs. select other countries dealing with COVID-19
3) Logarithmic Comparisons - Shows the US vs the other countries on the tracker.
4) Covid Vs Other Outbreaks - Compares the current COVID numbers to the last 10 years of flue and H1N1
5) US Weighted Averages - Explores 7 day vs 3 day weight average trends
6) Italy Summary
7) UK Summary
8) France Summary
9) Germany Summary
10) Sweden Summary
11) World Summary
NOTE: The daily growth rate data will not be accurate until the end of the day's postings. It will change throughout the day.
NOTE: I am not tracking individual states, I don't have a reliable consistent source for that data.
NOTE: I am not a mathematician, statistics guru, scientist, sharpest tack in the box, I'm just a guy who likes to understand for myself what is happening and to share it with others. This thread was not created to debate if you should or shouldn't take this seriously, it is simply to present the numbers and foster conversation.
NOTE: I have added a prediction number to the bottom of the data grid. This simply takes the previous days numbers and grows them at the previous day's growth rate. It should give the viewer some idea of what the numbers will look like today. Obviously, the final number for the day will be higher or lower based on what today's growth rate actualy is. This is just a simple indicator.
Posted on 4/6/20 at 8:48 am to Chromdome35
Thanks, Chrome! I wanna see this bastard bend, baby!
Posted on 4/6/20 at 9:27 am to trinidadtiger
quote:
Miami is a top 50 metro area in the world, Italy, particularly northern Italy doesnt make the top 100.
Lombardy has about 1100 residents per square mile.
Miami-Dade, Broward and Palm Beach counties have an average of about 1000 residents per square mile.
(ETA: Miami metro area has about 4/5 of a million more people than Milan, with about 6.1 and 5.25 million respectively.)
This post was edited on 4/6/20 at 10:02 am
Posted on 4/6/20 at 9:41 am to Chromdome35
0 recoveries this morning. How highly unlikely.
Posted on 4/6/20 at 9:56 am to ValDawgsta
Das a perty flat curv sha!
Posted on 4/6/20 at 10:21 am to Chromdome35
I'm predicting today will see another day of fewer confirmed cases (basically a week to 10 days ago). This week is when you see the stay at home orders taking into effect for confirmed case numbers since there have been fewer people in dense areas (events, sports, school, work, etc). Thus, less exposure load from the virus = fewer cases.
Hopefully I am right on this.
Hopefully I am right on this.
Posted on 4/6/20 at 10:26 am to uppermidwestbama
I don't know if we will see less than yesterday since it was a Sunday but we will start to see a trend, I agree.
Posted on 4/6/20 at 11:04 am to uppermidwestbama
quote:
I'm predicting today will see another day of fewer confirmed cases (basically a week to 10 days ago). This week is when you see the stay at home orders taking into effect for confirmed case numbers since there have been fewer people in dense areas (events, sports, school, work, etc). Thus, less exposure load from the virus = fewer cases.
Hopefully I am right on this.
It has to have an effect. DFW feels like a ghost town.
Posted on 4/6/20 at 11:14 am to trinidadtiger
Which is why I said it was a factor, not 100% the only variable.
Posted on 4/6/20 at 1:13 pm to TeLeFaWx
quote:
It has to have an effect. DFW feels like a ghost town.
Just saw this on Fox 4.
quote:
Dallas County reported just 43 new confirmed cases of COIVD-19 on Monday and no new deaths.
County health officials said that while there were some caveats to the low figure, there is hope that strict stay-at-home orders could be starting to pay off. The new case count comes just days after 100 new cases were reported on back-to-back days.
“While today’s positive case count is encouraging, I caution about reading too much into this number as several private labs were closed on Sunday. Having said that, the hospital systems are seeing evidence that the Dallas County Safer at Home executive order enacted on March 22nd is working to #FlattenTheCurve,” said Dallas County Judge Clay Jenkins. “Please continue adherence to the Safer at Home order to help save lives
LINK
This post was edited on 4/6/20 at 1:14 pm
Posted on 4/6/20 at 1:16 pm to nerd guy
quote:
the Dallas County Safer at Home executive order enacted on March 22nd is working to #FlattenTheCurve
It was always going to flatten, but they'll use this lie to convince everyone expansion of government is the only way.
Posted on 4/6/20 at 1:31 pm to Taxing Authority
Sent the data to you
Posted on 4/6/20 at 1:31 pm to buckeye_vol
Buckeye, do you want a copy of the data as well?
Posted on 4/6/20 at 1:35 pm to Chromdome35
This is the link to the COVID-19 Country tracker that I have shared on Google Drive. Chromdome's COVID-19 Daily Tracker
This is the link to the US state level tracker that I have shared via Google Drive. Chromdome's State Level COVID-19 Daily Tracker
On the state level tracker the states I have available right now are listed below. I will be adding additional states in the coming days.
Arkansas, Louisiana, New York, Georgia, Florida, California
The source for the data is https://www.worldometers.info/coronavirus/
The source for the testing data is from https://covidtracking.com/data/
On the tracker sheet you will see tabs for the following data:
1) US Summary
2) Country Comparables: This shows you how the US stacks up vs. select other countries dealing with COVID-19
3) Logarithmic Comparisons - Shows the US vs the other countries on the tracker.
4) Covid Vs Other Outbreaks - Compares the current COVID numbers to the last 10 years of flue and H1N1
5) US Weighted Averages - Explores 7 day vs 3 day weight average trends
6) Italy Summary
7) UK Summary
8) France Summary
9) Germany Summary
10) Sweden Summary
11) World Summary
NOTE: The daily growth rate data will not be accurate until the end of the day's postings. It will change throughout the day.
NOTE: I am not tracking individual states, I don't have a reliable consistent source for that data.
NOTE: I am not a mathematician, statistics guru, scientist, sharpest tack in the box, I'm just a guy who likes to understand for myself what is happening and to share it with others. This thread was not created to debate if you should or shouldn't take this seriously, it is simply to present the numbers and foster conversation.
NOTE: I have added a prediction number to the bottom of the data grid. This simply takes the previous days numbers and grows them at the previous day's growth rate. It should give the viewer some idea of what the numbers will look like today. Obviously, the final number for the day will be higher or lower based on what today's growth rate actualy is. This is just a simple indicator.

This is the link to the US state level tracker that I have shared via Google Drive. Chromdome's State Level COVID-19 Daily Tracker
On the state level tracker the states I have available right now are listed below. I will be adding additional states in the coming days.
Arkansas, Louisiana, New York, Georgia, Florida, California
The source for the data is https://www.worldometers.info/coronavirus/
The source for the testing data is from https://covidtracking.com/data/
On the tracker sheet you will see tabs for the following data:
1) US Summary
2) Country Comparables: This shows you how the US stacks up vs. select other countries dealing with COVID-19
3) Logarithmic Comparisons - Shows the US vs the other countries on the tracker.
4) Covid Vs Other Outbreaks - Compares the current COVID numbers to the last 10 years of flue and H1N1
5) US Weighted Averages - Explores 7 day vs 3 day weight average trends
6) Italy Summary
7) UK Summary
8) France Summary
9) Germany Summary
10) Sweden Summary
11) World Summary
NOTE: The daily growth rate data will not be accurate until the end of the day's postings. It will change throughout the day.
NOTE: I am not tracking individual states, I don't have a reliable consistent source for that data.
NOTE: I am not a mathematician, statistics guru, scientist, sharpest tack in the box, I'm just a guy who likes to understand for myself what is happening and to share it with others. This thread was not created to debate if you should or shouldn't take this seriously, it is simply to present the numbers and foster conversation.
NOTE: I have added a prediction number to the bottom of the data grid. This simply takes the previous days numbers and grows them at the previous day's growth rate. It should give the viewer some idea of what the numbers will look like today. Obviously, the final number for the day will be higher or lower based on what today's growth rate actualy is. This is just a simple indicator.
Posted on 4/6/20 at 1:39 pm to Chromdome35
New York seems to only update once a day, in the mid-morning or early afternoon.
Theirs are part of this latest update. We'll see a growth in deaths/day from yesterday, but I don't think it'll surpass 1,500. We'll see, though.
Theirs are part of this latest update. We'll see a growth in deaths/day from yesterday, but I don't think it'll surpass 1,500. We'll see, though.
Posted on 4/6/20 at 1:41 pm to Eat Your Crow
There have been many days where they update in the evening as well.
Posted on 4/6/20 at 1:43 pm to Chromdome35
The last few days I've seen the vast majority of their reported cases/deaths come in the morning. I could very well be wrong on that, though.

 Page 141 of 331



Popular

Back to top
 Follow TigerDroppings for LSU Football News