




 0
0





- My Forums
- Tiger Rant
- LSU Recruiting
- SEC Rant
- Saints Talk
- Pelicans Talk
- More Sports Board
- Fantasy Sports
- Golf Board
- Soccer Board
- O-T Lounge
- Tech Board
- Home/Garden Board
- Outdoor Board
- Health/Fitness Board
- Movie/TV Board
- Book Board
- Music Board
- Political Talk
- Money Talk
- Fark Board
- Gaming Board
- Travel Board
- Food/Drink Board
- Ticket Exchange
- TD Help Board
Customize My Forums- View All Forums
- Show Left Links
- Topic Sort Options
- Trending Topics
- Recent Topics
- Active Topics
Started By
Message
re: Daily COVID Updated as of 11/2/20 8:00 PM
Posted on 4/4/20 at 5:54 pm to the808bass
Posted on 4/4/20 at 5:54 pm to the808bass
That’s a ridiculous number to throw out there
Posted on 4/4/20 at 5:57 pm to Eat Your Crow
I think I’m a bit high, actually. Thanks for making me recheck that. I’m going to guess will be probably more around 3300 to 4000 deaths in 10 days.
Early data was skewing my ratios. New cases X around 12% to get a very rough estimate of mortality 10 days later.
Early data was skewing my ratios. New cases X around 12% to get a very rough estimate of mortality 10 days later.
Posted on 4/4/20 at 6:11 pm to the808bass
It's pretty crazy to look at the exponential growth curve for deaths in New York. It just started getting really bad there in terms of deaths about a week or week and a half ago, and it'll basically all be over there by the end of this month, probably.
Since social distancing is not as easily accomplished there for many reasons (at least compared to the measures being taken in other places around the country), it's a decent case study to compare to some other places around the country/world in terms of precautionary measures taken, herd immunity, population demographics, etc. For people much smarter than me, of course.
Since social distancing is not as easily accomplished there for many reasons (at least compared to the measures being taken in other places around the country), it's a decent case study to compare to some other places around the country/world in terms of precautionary measures taken, herd immunity, population demographics, etc. For people much smarter than me, of course.
This post was edited on 4/4/20 at 6:13 pm
Posted on 4/4/20 at 6:16 pm to the808bass
quote:
I’m going to guess will be probably more around 3300 to 4000 deaths in 10 days.
I could see that happening but I’d bet (or maybe I’m just hopeful) it doesn’t peak that high. For whatever it’s worth, that university of Washington projections model said we’ll peak nationally on April 16th at 2644 deaths that day.
On a related note their last update was on April 1st and the website says there’ll be an updated projection today. Eager to see that.
Posted on 4/4/20 at 6:17 pm to ValDawgsta
quote:
On a related note their last update was on April 1st and the website says there’ll be an updated projection today. Eager to see that.
Same data I linked on the bottom of last page. Yes, very much looking forward to their new projection.
Posted on 4/4/20 at 6:20 pm to ValDawgsta
Worldometers just updated about 10 mins ago with 1,037 new deaths for the day, I presume. Considering we might see one more small update tonight, that's not so bad at all.
If I'm reading the new death number correctly, of course.
If I'm reading the new death number correctly, of course.
Posted on 4/4/20 at 6:37 pm to dafif
quote:
Florida as of 6pm
The link I posted is a PREDICTER of Influenza and has been a pretty accurate barometer CV-19.
Nothing to do with today's numbers.
Posted on 4/4/20 at 7:05 pm to Eat Your Crow
quote:
Considering we might see one more small update tonight, that's not so bad at all.
That's an awfully low number for New York.
Posted on 4/4/20 at 7:19 pm to the808bass
quote:
I’m going to guess will be probably more around 3300 to 4000 deaths in 10 days.
The healthdata.org chart is modelling very close to that as a worst case for the 14th, with the worst case peaking at about 4400 deaths on the 21st. We're right on the line for the "middle" course for today, so far.
And the worst case there appears to be under 180k total, with a best case looking like closer to 93k.
This post was edited on 4/4/20 at 8:28 pm
Posted on 4/4/20 at 7:54 pm to the808bass
quote:
I think I’m a bit high, actually. Thanks for making me recheck that. I’m going to guess will be probably more around 3300 to 4000 deaths in 10 days.
awful. It's starting to look like my "2k a day peak, 50-70k max deaths" was reverse wishcasting. I will continue to do so regardless

Posted on 4/4/20 at 8:07 pm to ApexTiger
quote:
why aren't the infections numbers doubling every 2 days?
Who cares?
It's an unbelievably vague statistic.
The only way to know if it's doubling or not is to test . millions and we still wouldn't know.
Hospilizations of CV and deaths are the 2 most important figures.
Posted on 4/4/20 at 8:34 pm to Tiguar
Same.
If we can avoid any more New Yorks, it may not be wishcasting.
If we can avoid any more New Yorks, it may not be wishcasting.
Posted on 4/4/20 at 8:35 pm to Chromdome35
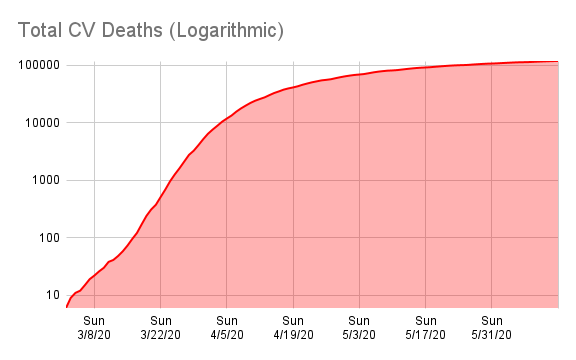
This is the link to the COVID-19 Country tracker that I have shared on Google Drive. Chromdome's COVID-19 Daily Tracker
This is the link to the US state level tracker that I have shared via Google Drive. Chromdome's State Level COVID-19 Daily Tracker
On the state level tracker the states I have available right now are listed below. I will be adding additional states in the coming days.
Arkansas, Louisiana, New York, Georgia, Florida, California
The source for the data is https://www.worldometers.info/coronavirus/
The source for the testing data is from https://covidtracking.com/data/
On the tracker sheet you will see tabs for the following data:
1) US Summary
2) Country Comparables: This shows you how the US stacks up vs. select other countries dealing with COVID-19
3) Logarithmic Comparisons - Shows the US vs the other countries on the tracker.
4) Covid Vs Other Outbreaks - Compares the current COVID numbers to the last 10 years of flue and H1N1
5) US Weighted Averages - Explores 7 day vs 3 day weight average trends
6) Italy Summary
7) UK Summary
8) France Summary
9) Germany Summary
10) Sweden Summary
11) World Summary
NOTE: The daily growth rate data will not be accurate until the end of the day's postings. It will change throughout the day.
NOTE: I am not tracking individual states, I don't have a reliable consistent source for that data.
NOTE: I am not a mathematician, statistics guru, scientist, sharpest tack in the box, I'm just a guy who likes to understand for myself what is happening and to share it with others. This thread was not created to debate if you should or shouldn't take this seriously, it is simply to present the numbers and foster conversation.
NOTE: I have added a prediction number to the bottom of the data grid. This simply takes the previous days numbers and grows them at the previous day's growth rate. It should give the viewer some idea of what the numbers will look like today. Obviously, the final number for the day will be higher or lower based on what today's growth rate actualy is. This is just a simple indicator.






This is the link to the US state level tracker that I have shared via Google Drive. Chromdome's State Level COVID-19 Daily Tracker
On the state level tracker the states I have available right now are listed below. I will be adding additional states in the coming days.
Arkansas, Louisiana, New York, Georgia, Florida, California
The source for the data is https://www.worldometers.info/coronavirus/
The source for the testing data is from https://covidtracking.com/data/
On the tracker sheet you will see tabs for the following data:
1) US Summary
2) Country Comparables: This shows you how the US stacks up vs. select other countries dealing with COVID-19
3) Logarithmic Comparisons - Shows the US vs the other countries on the tracker.
4) Covid Vs Other Outbreaks - Compares the current COVID numbers to the last 10 years of flue and H1N1
5) US Weighted Averages - Explores 7 day vs 3 day weight average trends
6) Italy Summary
7) UK Summary
8) France Summary
9) Germany Summary
10) Sweden Summary
11) World Summary
NOTE: The daily growth rate data will not be accurate until the end of the day's postings. It will change throughout the day.
NOTE: I am not tracking individual states, I don't have a reliable consistent source for that data.
NOTE: I am not a mathematician, statistics guru, scientist, sharpest tack in the box, I'm just a guy who likes to understand for myself what is happening and to share it with others. This thread was not created to debate if you should or shouldn't take this seriously, it is simply to present the numbers and foster conversation.
NOTE: I have added a prediction number to the bottom of the data grid. This simply takes the previous days numbers and grows them at the previous day's growth rate. It should give the viewer some idea of what the numbers will look like today. Obviously, the final number for the day will be higher or lower based on what today's growth rate actualy is. This is just a simple indicator.
This post was edited on 4/4/20 at 8:58 pm
Posted on 4/4/20 at 8:40 pm to Chromdome35
Growth rate for confirmed cases per day continues to decline. We are already seeing the death rate per day starting to decline.
We will be out of this sooner than the models have projected and I don't think the peak is going to be much more than it already is.
Even with all of the new testing going on we still only see the increase become 2k more cases, 3k more cases, and 4k more cases. And a lot of those are coming from two states.
I was thinking our peak would be around next weekend. Seems to me we are already starting to see the numbers slowing and soon we will see fewer cases per day starting to do drop.
Next week we will see days there the growth of confirmed cases per day is below 12 percent. I was thinking we wouldn't get to below 12 percent for about another 10 days, but I bet we hit that mark next week.
Sometime this month our growth rate of confirmed cases will be negative.
We will be out of this sooner than the models have projected and I don't think the peak is going to be much more than it already is.
Even with all of the new testing going on we still only see the increase become 2k more cases, 3k more cases, and 4k more cases. And a lot of those are coming from two states.
I was thinking our peak would be around next weekend. Seems to me we are already starting to see the numbers slowing and soon we will see fewer cases per day starting to do drop.
Next week we will see days there the growth of confirmed cases per day is below 12 percent. I was thinking we wouldn't get to below 12 percent for about another 10 days, but I bet we hit that mark next week.
Sometime this month our growth rate of confirmed cases will be negative.
Posted on 4/4/20 at 8:41 pm to Chromdome35
Chrome, it looks like the Saturday deaths were updated again to 1,331 after your most recent update.
Posted on 4/4/20 at 8:43 pm to LSURussian
Russian can you look at my post on the Political (should be money) board about the PP loans and the credit availability? I had a question for you there.
Sorry to post his here but I see you posted
Sorry to post his here but I see you posted
This post was edited on 4/4/20 at 8:50 pm
Posted on 4/4/20 at 8:46 pm to Chromdome35
The growth rate of cases slowed again, that is continued good news.
Testing took a big jump up today and hit a new daily high of 216K
The deaths number has been all over the board lately, it is hard to see a clear picture of the death curve.
We are being warned that this week will be the toughest, We need these curves to show some serious flattening pretty quickly, or this won't be the worst to come.
Testing took a big jump up today and hit a new daily high of 216K
The deaths number has been all over the board lately, it is hard to see a clear picture of the death curve.
We are being warned that this week will be the toughest, We need these curves to show some serious flattening pretty quickly, or this won't be the worst to come.
Posted on 4/4/20 at 8:46 pm to uppermidwestbama
From March 22nd to today we went from cases doubling every 2 days to now doubling every 5 days. Our growth rate of new confirmed cases is really starting to slow.

Posted on 4/4/20 at 8:47 pm to Chromdome35
growth rate is slowing but I was really hoping to not see 30k/day increases in cases 3 weeks after we started taking this serious.
Posted on 4/4/20 at 8:48 pm to LSURussian
It actually looks like they downgraded friday's numbers.
EDIT: They did downgrade Friday to 1050 deaths, a 271 change. That really flipped the growth rates numbers around. Today is actually higher than yesterday now.
EDIT: They did downgrade Friday to 1050 deaths, a 271 change. That really flipped the growth rates numbers around. Today is actually higher than yesterday now.
This post was edited on 4/4/20 at 8:55 pm

 Page 133 of 331



Popular

Back to top
 Follow TigerDroppings for LSU Football News