




 0
0








- My Forums
- Tiger Rant
- LSU Recruiting
- SEC Rant
- Saints Talk
- Pelicans Talk
- More Sports Board
- Fantasy Sports
- Golf Board
- Soccer Board
- O-T Lounge
- Tech Board
- Home/Garden Board
- Outdoor Board
- Health/Fitness Board
- Movie/TV Board
- Book Board
- Music Board
- Political Talk
- Money Talk
- Fark Board
- Gaming Board
- Travel Board
- Food/Drink Board
- Ticket Exchange
- TD Help Board
Customize My Forums- View All Forums
- Show Left Links
- Topic Sort Options
- Trending Topics
- Recent Topics
- Active Topics
Started By
Message
re: Daily COVID Updated as of 11/2/20 8:00 PM
Posted on 4/2/20 at 10:06 pm to VolInBavaria
Posted on 4/2/20 at 10:06 pm to VolInBavaria
Just a function of limited testing capacity and how we are testing people.
Posted on 4/2/20 at 10:21 pm to Janky
quote:Yes. Watch the thrird chart in Chromedome's posts. "Daily Growth Rate of New CV Cases". Think of it like this... As long as that is above 0 we are accelerating, not braking. Looks like the trend toward 0 is pretty broken. Ugh.
Birx was saying we are still climbing like Italy and Spain. Is she talking about new cases?
Posted on 4/2/20 at 10:23 pm to Taxing Authority
Of course it could be a second order derivative problem. We're increasing but at a decreasing rate.
Posted on 4/2/20 at 10:24 pm to Powerman
quote:We're not even close to any "peak". Cases or deaths.
If yesterday was the peak that would be great news
Posted on 4/2/20 at 10:31 pm to Powerman
quote:That was the case, but looks to be flattening out. My guess it stays there a good while. We're a big country so were likely to see cases propagating through new regions. More testing coming on line also flattens things out.
Of course it could be a second order derivative problem. We're increasing but at a decreasing rate.
But the first good news point is hitting 0 on that chart.
Posted on 4/2/20 at 10:35 pm to Taxing Authority
That’s not the flat curve we want or need.
It really looks like it will level out at around 13% - 14%
It really looks like it will level out at around 13% - 14%
Posted on 4/2/20 at 10:37 pm to Chromdome35
quote:
It really looks like it will level out at around 13% - 14%
It’s not going to continue upwards forever. It can’t. And it won’t. The question is do we end up with 2M dead or 50k dead.
Posted on 4/2/20 at 10:48 pm to the808bass
Man if we get more then 500k dead from this thing we better go to kinetic, hot, bomb dropping bullet shooting war against China.
We lost our shite over 3k deaths on 9/11 and invaded Iraq because they might possibly one day have yellow cake or whatever.
We lost our shite over 3k deaths on 9/11 and invaded Iraq because they might possibly one day have yellow cake or whatever.
Posted on 4/2/20 at 10:50 pm to Taxing Authority
This is one of the graphs I'm paying the most attention to. You can clearly see the slope of the curve for deaths is much steeper and not exhibiting a declining growth rate like the curve for Total Cases.
I believe the lower slope of the Cases curve is a direct reflection of the lab bottlenecks, the only way you get cases is to give tests whereas deaths have no such constraint. We'll have deaths regardless of if we test or not.
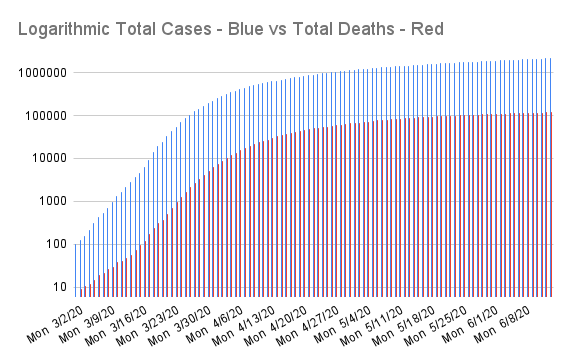
This also explains why the mortality rate is growing higher every day.
IF we had wide-open testing with no delays in results, I believe we'd see a growth curve that matches the death curve. But we don't have unlimited testing so our best indicator of when this thing is slowing down is when the death rate starts to fall off.
I believe the lower slope of the Cases curve is a direct reflection of the lab bottlenecks, the only way you get cases is to give tests whereas deaths have no such constraint. We'll have deaths regardless of if we test or not.
This also explains why the mortality rate is growing higher every day.
IF we had wide-open testing with no delays in results, I believe we'd see a growth curve that matches the death curve. But we don't have unlimited testing so our best indicator of when this thing is slowing down is when the death rate starts to fall off.
This post was edited on 4/2/20 at 10:55 pm
Posted on 4/2/20 at 10:53 pm to Chromdome35
The exponential growth we saw earlier in this was my cue we weren’t limited by testing. I think I said somewhere if we ever saw linear growth, it would represent a bottle neck in testing.
We may not be seeing a flattening of the new case curve but rather a linearization
We may not be seeing a flattening of the new case curve but rather a linearization
Posted on 4/2/20 at 10:55 pm to Chromdome35
quote:Yeah, but it's going to lag. Today's deaths slope shouldn't be compared to today's case slope. It should be compared to the slope 14 days ago (or so).
You can clearly see the slope of the curve for deaths is much steeper and not exhibiting a declining growth rate like the curve for Total Cases.
Posted on 4/2/20 at 10:59 pm to Tiguar
Tiguar, Looking at these graphs of testing numbers, it looks to me like we've been leveled out at around 105K-110K daily testing for 8 days.
The Log graph shows a definite slow down

The daily tests administered graph shows us hanging out in the same range for 8 days.
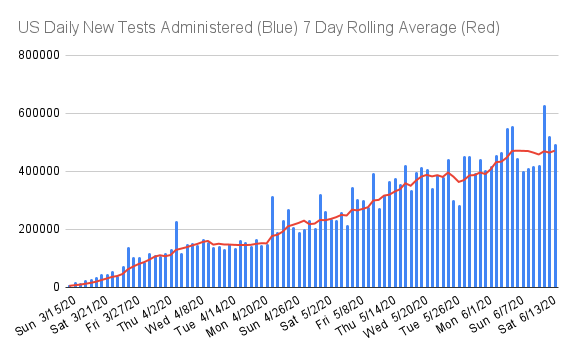
And the growth rate has fallen to 10.2%
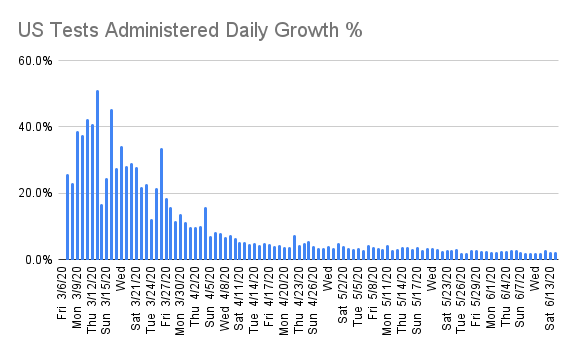
The Log graph shows a definite slow down
The daily tests administered graph shows us hanging out in the same range for 8 days.
And the growth rate has fallen to 10.2%
Posted on 4/2/20 at 11:01 pm to Tiguar
The problem that you get, when using percentages based on accumulated totals to measure growth: The same, or even slightly more numbers, will always show a falling percentage of accumulated totals. It can be misleading.
Posted on 4/2/20 at 11:04 pm to Chromdome35
It's hard to know what's going on with testing. If they're still limiting tests to symptomatic / seriusly ill people--maybe they are running out of people to test.
Some way to quantify the number of infected (not number of people tested positive) would be a huge breakthrough on figuring this thing out.
Some way to quantify the number of infected (not number of people tested positive) would be a huge breakthrough on figuring this thing out.
Posted on 4/2/20 at 11:04 pm to Chromdome35
This begs the question:
If we are administering the same/similar amount of tests every day, why do we still get numerically more cases every day over the last raise?
Example: 20k cases one day, + 24k cases the next day. Both days had same amount of tests.
Are we getting better at identifying good candidates to test who are likely positive.....or is a higher proportion of the population getting infected every day. Or both
If we are administering the same/similar amount of tests every day, why do we still get numerically more cases every day over the last raise?
Example: 20k cases one day, + 24k cases the next day. Both days had same amount of tests.
Are we getting better at identifying good candidates to test who are likely positive.....or is a higher proportion of the population getting infected every day. Or both
This post was edited on 4/2/20 at 11:06 pm
Posted on 4/2/20 at 11:05 pm to Taxing Authority
I understand what you are saying and I don't think it is mutually exclusive with what I'm talking about.
I think the case numbers are so understated to the point where I'm not sure they matter at all. We know deaths represent some % of total cases, which means the unknown case curve can be assumed to be matching the death curve.
Since we don't have a clear view of the actual case curve (due to testing limitations) we won't know its gone down until roughly 14 days later when the death curve starts declining.
I think the case numbers are so understated to the point where I'm not sure they matter at all. We know deaths represent some % of total cases, which means the unknown case curve can be assumed to be matching the death curve.
Since we don't have a clear view of the actual case curve (due to testing limitations) we won't know its gone down until roughly 14 days later when the death curve starts declining.
Posted on 4/2/20 at 11:07 pm to auggie
quote:Always a good reminder. One of my mentors always said "Never trust an modeler that uses percentages or averages"
The problem that you get, when using percentages based on accumulated totals to measure growth: The same, or even slightly more numbers, will always show a falling percentage of accumulated totals. It can be misleading.

Posted on 4/2/20 at 11:08 pm to Tiguar
quote:Backlog?
why do we still get numerically more cases every day over the last raise?
Posted on 4/2/20 at 11:08 pm to auggie
You are 100% correct.
Posted on 4/2/20 at 11:09 pm to Chromdome35
quote:yup. Let's hope the cases curve atleast flattens soon.
we won't know its gone down until roughly 14 days later when the death curve starts declining.

 Page 126 of 331



Popular

Back to top
 Follow TigerDroppings for LSU Football News