




 0
0








- My Forums
- Tiger Rant
- LSU Recruiting
- SEC Rant
- Saints Talk
- Pelicans Talk
- More Sports Board
- Fantasy Sports
- Golf Board
- Soccer Board
- O-T Lounge
- Tech Board
- Home/Garden Board
- Outdoor Board
- Health/Fitness Board
- Movie/TV Board
- Book Board
- Music Board
- Political Talk
- Money Talk
- Fark Board
- Gaming Board
- Travel Board
- Food/Drink Board
- Ticket Exchange
- TD Help Board
Customize My Forums- View All Forums
- Show Left Links
- Topic Sort Options
- Trending Topics
- Recent Topics
- Active Topics
Started By
Message
re: Daily COVID Updated as of 11/2/20 8:00 PM
Posted on 3/30/20 at 8:36 pm to Chromdome35
Posted on 3/30/20 at 8:36 pm to Chromdome35
Huh new cases have stuck around 20k the last 4-5 days
Definitely think yesterdays bled into today as that's been fairly consistent on Mondays.
Thanks as always
Definitely think yesterdays bled into today as that's been fairly consistent on Mondays.
Thanks as always
Posted on 3/30/20 at 9:14 pm to Chromdome35
This is the link to the COVID-19 tracker that I have shared on Google Drive. Chromdome's COVID-19 Daily Tracker
The source for the data is https://www.worldometers.info/coronavirus/
The source for the testing data is from https://covidtracking.com/data/
On the tracker sheet you will see tabs for the following data:
1) US Summary
2) Country Comparables: This shows you how the US stacks up vs. select other countries dealing with COVID-19
3) Logarithmic Comparisons - Shows the US vs the other countries on the tracker.
4) Covid Vs Other Outbreaks - Compares the current COVID numbers to the last 10 years of flue and H1N1
5) US Weighted Averages - Explores 7 day vs 3 day weight average trends
6) Italy Summary
7) UK Summary
8) France Summary
9) Germany Summary
10) Sweden Summary
11) World Summary
NOTE: The daily growth rate data will not be accurate until the end of the day's postings. It will change throughout the day.
NOTE: I am not tracking individual states, I don't have a reliable consistent source for that data.
NOTE: I am not a mathematician, statistics guru, scientist, sharpest tack in the box, I'm just a guy who likes to understand for myself what is happening and to share it with others. This thread was not created to debate if you should or shouldn't take this seriously, it is simply to present the numbers and foster conversation.
I changed the formating of the numbers in the table to reflect positive movements (Green) vs negative movements (Red). This will allow you to quickly see how the numbers are moving.

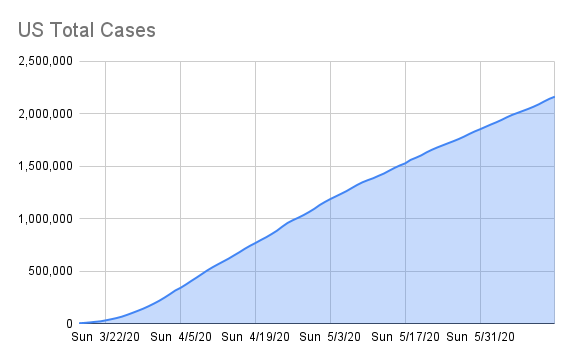



The source for the data is https://www.worldometers.info/coronavirus/
The source for the testing data is from https://covidtracking.com/data/
On the tracker sheet you will see tabs for the following data:
1) US Summary
2) Country Comparables: This shows you how the US stacks up vs. select other countries dealing with COVID-19
3) Logarithmic Comparisons - Shows the US vs the other countries on the tracker.
4) Covid Vs Other Outbreaks - Compares the current COVID numbers to the last 10 years of flue and H1N1
5) US Weighted Averages - Explores 7 day vs 3 day weight average trends
6) Italy Summary
7) UK Summary
8) France Summary
9) Germany Summary
10) Sweden Summary
11) World Summary
NOTE: The daily growth rate data will not be accurate until the end of the day's postings. It will change throughout the day.
NOTE: I am not tracking individual states, I don't have a reliable consistent source for that data.
NOTE: I am not a mathematician, statistics guru, scientist, sharpest tack in the box, I'm just a guy who likes to understand for myself what is happening and to share it with others. This thread was not created to debate if you should or shouldn't take this seriously, it is simply to present the numbers and foster conversation.
I changed the formating of the numbers in the table to reflect positive movements (Green) vs negative movements (Red). This will allow you to quickly see how the numbers are moving.
Posted on 3/30/20 at 9:17 pm to Janky
quote:
Any chance some of this is rollover from the weekend?
Yep
Posted on 3/30/20 at 9:20 pm to Chromdome35
That video posted earlier had a good plot of new cases (y axis) versus cumulative cases (x-axis) both on a log scale. On that plot you can clearly see the break in the exponential growth. If you haven’t already you might consider adding that plot.
Posted on 3/30/20 at 9:23 pm to Chromdome35
Really not too bad of a day.
I suspected yesterday's numbers might be artifically low and they do appear to be; however, when you look at yesterday's new cases at 19,993 and today's at 20,353 and then consider that today is probably high, then if we moved even 500 cases back to yesterday it would have meant that today was actually lower than yesterday in new cases...that would be HUGE.
Deaths rose 22.2% over yesterday a 5.4% increase; however, assuming some of today's deaths should have been attributed to yesterday, the tick up isn't quite as bad.
The doubling rate for new cases continues to improve and may get to 5 if the current trend continues. The doubling rate of deaths has been increasing for 5 days in a row and reached 4 days today, which is a healthy improvement over where it was 5 days ago at 3.2 days.
Its a bit concerning that the mortality rate continues to increase, approaching 2%.
I suspected yesterday's numbers might be artifically low and they do appear to be; however, when you look at yesterday's new cases at 19,993 and today's at 20,353 and then consider that today is probably high, then if we moved even 500 cases back to yesterday it would have meant that today was actually lower than yesterday in new cases...that would be HUGE.
Deaths rose 22.2% over yesterday a 5.4% increase; however, assuming some of today's deaths should have been attributed to yesterday, the tick up isn't quite as bad.
The doubling rate for new cases continues to improve and may get to 5 if the current trend continues. The doubling rate of deaths has been increasing for 5 days in a row and reached 4 days today, which is a healthy improvement over where it was 5 days ago at 3.2 days.
Its a bit concerning that the mortality rate continues to increase, approaching 2%.
Posted on 3/30/20 at 9:25 pm to Chromdome35
Can you add mortality per capita rate?
Posted on 3/30/20 at 9:27 pm to Chromdome35
quote:
Its a bit concerning that the mortality rate continues to increase, approaching 2%.
I don’t suspect we’re capturing even 50% of cases. So the published CFR is always going to be high until we establish the prevalence of the infection to a far more accurate degree.
Posted on 3/30/20 at 9:31 pm to the808bass
Today marks the first time in two weeks that the total number of deaths in the US from the Coronavirus did not double in 3 days. We'll see Tuesday if that's a trend, or a blip.
Posted on 3/30/20 at 9:46 pm to uppermidwestbama
We had another nursing home hit here today in Tennessee. That’s the biggest issue with this virus, a conglomeration of elderly and sick people trapped in tight quarters.
Posted on 3/30/20 at 9:47 pm to ItNeverRains
What town? Nvm. Found it
This post was edited on 3/30/20 at 9:53 pm
Posted on 3/30/20 at 9:49 pm to ItNeverRains
quote:
We had another nursing home hit here today in Tennessee. That’s the biggest issue with this virus, a conglomeration of elderly and sick people trapped in tight quarters.
Yea same issues in the Dallas/Fort Worth area. Dallas had 3 nursing homes hit (2 clusters of positives and 1 with a single patient). But the worst, I think, is a state assisted living home near Denton with 70 positives alone. Denton county has a total of 191 positives.
This post was edited on 3/30/20 at 10:54 pm
Posted on 3/30/20 at 9:56 pm to the808bass
50%? It is closer to 80-85%
Posted on 3/30/20 at 9:58 pm to TigerCruise
It’s probably somewhere in that range. It’s almost certainly over 50%.
Posted on 3/30/20 at 10:01 pm to lsumatt
Matt, I'm trying to replicate that in google sheets, this is the best I can come up with.

This post was edited on 3/30/20 at 10:01 pm
Posted on 3/30/20 at 10:02 pm to schexyoung
That data is in the table under the column heading Deaths per Million Population, or are you asking for a graph?
Posted on 3/30/20 at 10:02 pm to the808bass
California, Michigan, New Jersey, and soon Pennsylvania are going to start ramping up a bit. Should balance out the numbers a bit but may ruin our lovely downtrend of growth rate unless NY really slows down more.
Posted on 3/30/20 at 10:30 pm to Tiguar
As it is now, New York isn't the worry anymore. They exploded in their growth but it has been slowing down in doubling to every 6 days now. Still lots of people getting Covid and ending up in the hospital, but in a couple of weeks they should be at their peak.
NYC now has their equipment, extra beds, stay at home orders, and lots of death already occurring.
The worry is not having other areas of our country become a NYC. If that does happen we are fricked for getting out of this soon. If states are smart they will cracdown on things to keep their states/large cities from becoming a NYC "war zone".
In the last four days, hospitalizations of coronavirus patients in California have doubled, and the number of patients in intensive care has tripled. That's the scary part of this.
Right now California only has 2,474 confirmed cases. Cross the fingers that warm weather and the state already have stay at home orders for a couple of weeks already pays off and they don't become a NYC.
NYC now has their equipment, extra beds, stay at home orders, and lots of death already occurring.
The worry is not having other areas of our country become a NYC. If that does happen we are fricked for getting out of this soon. If states are smart they will cracdown on things to keep their states/large cities from becoming a NYC "war zone".
In the last four days, hospitalizations of coronavirus patients in California have doubled, and the number of patients in intensive care has tripled. That's the scary part of this.
Right now California only has 2,474 confirmed cases. Cross the fingers that warm weather and the state already have stay at home orders for a couple of weeks already pays off and they don't become a NYC.
Posted on 3/31/20 at 1:31 am to the808bass
quote:if the numbers for flu were reported the same way covid currently is you would see a similar mortality rate. They don't even try to directly count the number of cases of flu each year via testing because it's impossible, the numbers are taken from viral models that factor in estimated unreprted cases. If you just divided the number of people that actually tested positive for flu by the number that died of flu (which they know pretty accurately) you would get a shocking figure. This is exactly how covid numbers are reported now
quote:
Its a bit concerning that the mortality rate continues to increase, approaching 2%.
I don’t suspect we’re capturing even 50% of cases. So the published CFR is always going to be high until we establish the prevalence of the infection to a far more accurate degree.
This post was edited on 3/31/20 at 1:35 am
Posted on 3/31/20 at 7:43 am to narddogg81
quote:
if the numbers for flu were reported the same way covid currently is you would see a similar mortality rate. They don't even try to directly count the number of cases of flu each year via testing because it's impossible, the numbers are taken from viral models that factor in estimated unreprted cases. If you just divided the number of people that actually tested positive for flu by the number that died of flu (which they know pretty accurately) you would get a shocking figure. This is exactly how covid numbers are reported now
If you go on the CDC website you’ll see that BEFORE the estimates of people not tested are factored in the flu has a 10% mortality rate. But after they factor in the estimates it goes down to .1%
This post was edited on 3/31/20 at 7:44 am
Posted on 3/31/20 at 8:38 am to Chromdome35
Looks like the growth rate is slowing. Is that because of social distancing or are they testing fewer people?

 Page 104 of 331



Popular

Back to top
 Follow TigerDroppings for LSU Football News