




 3
3







- My Forums
- Tiger Rant
- LSU Recruiting
- SEC Rant
- Saints Talk
- Pelicans Talk
- More Sports Board
- Fantasy Sports
- Golf Board
- Soccer Board
- O-T Lounge
- Tech Board
- Home/Garden Board
- Outdoor Board
- Health/Fitness Board
- Movie/TV Board
- Book Board
- Music Board
- Political Talk
- Money Talk
- Fark Board
- Gaming Board
- Travel Board
- Food/Drink Board
- Ticket Exchange
- TD Help Board
Customize My Forums- View All Forums
- Show Left Links
- Topic Sort Options
- Trending Topics
- Recent Topics
- Active Topics
Started By
Message
re: Daily COVID Updated as of 11/2/20 8:00 PM
Posted on 3/31/20 at 8:41 am to Chromdome35
Posted on 3/31/20 at 8:41 am to Chromdome35
This is the link to the COVID-19 tracker that I have shared on Google Drive. Chromdome's COVID-19 Daily Tracker
The source for the data is https://www.worldometers.info/coronavirus/
The source for the testing data is from https://covidtracking.com/data/
On the tracker sheet you will see tabs for the following data:
1) US Summary
2) Country Comparables: This shows you how the US stacks up vs. select other countries dealing with COVID-19
3) Logarithmic Comparisons - Shows the US vs the other countries on the tracker.
4) Covid Vs Other Outbreaks - Compares the current COVID numbers to the last 10 years of flue and H1N1
5) US Weighted Averages - Explores 7 day vs 3 day weight average trends
6) Italy Summary
7) UK Summary
8) France Summary
9) Germany Summary
10) Sweden Summary
11) World Summary
NOTE: The daily growth rate data will not be accurate until the end of the day's postings. It will change throughout the day.
NOTE: I am not tracking individual states, I don't have a reliable consistent source for that data.
NOTE: I am not a mathematician, statistics guru, scientist, sharpest tack in the box, I'm just a guy who likes to understand for myself what is happening and to share it with others. This thread was not created to debate if you should or shouldn't take this seriously, it is simply to present the numbers and foster conversation.

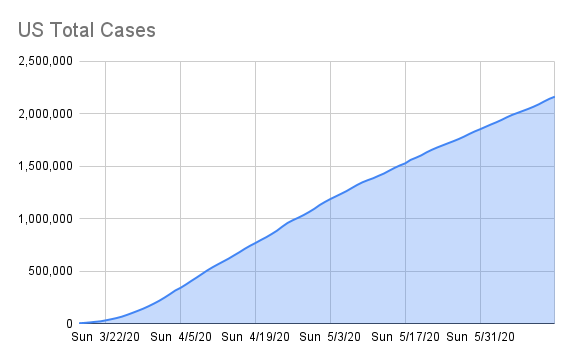



The source for the data is https://www.worldometers.info/coronavirus/
The source for the testing data is from https://covidtracking.com/data/
On the tracker sheet you will see tabs for the following data:
1) US Summary
2) Country Comparables: This shows you how the US stacks up vs. select other countries dealing with COVID-19
3) Logarithmic Comparisons - Shows the US vs the other countries on the tracker.
4) Covid Vs Other Outbreaks - Compares the current COVID numbers to the last 10 years of flue and H1N1
5) US Weighted Averages - Explores 7 day vs 3 day weight average trends
6) Italy Summary
7) UK Summary
8) France Summary
9) Germany Summary
10) Sweden Summary
11) World Summary
NOTE: The daily growth rate data will not be accurate until the end of the day's postings. It will change throughout the day.
NOTE: I am not tracking individual states, I don't have a reliable consistent source for that data.
NOTE: I am not a mathematician, statistics guru, scientist, sharpest tack in the box, I'm just a guy who likes to understand for myself what is happening and to share it with others. This thread was not created to debate if you should or shouldn't take this seriously, it is simply to present the numbers and foster conversation.
Posted on 3/31/20 at 8:54 am to Chromdome35
Can someone help with a question about that website that has the "days until peak" info?
On Sunday the peak for Louisiana (my state ugh) said 8 days. Yesterday it said 10 days.
If the "days until peak" keeps getting moved, will "leaders" keep moving the end of "stay home" back? The point of doing what we're doing is to NOT reach a peak for resources.
Edited again -- the info Chrome just posted shows a slowing death rate and case growth ... are we nearing the top of the curve? Dear Lord I wish I didn't feel dumb.
eta: and if NY is having a decline in hospital admissions, why do they still need 50 million ventilators/beds?
Thanks for any insight -- I stink at reading most of these things.
On Sunday the peak for Louisiana (my state ugh) said 8 days. Yesterday it said 10 days.
If the "days until peak" keeps getting moved, will "leaders" keep moving the end of "stay home" back? The point of doing what we're doing is to NOT reach a peak for resources.
Edited again -- the info Chrome just posted shows a slowing death rate and case growth ... are we nearing the top of the curve? Dear Lord I wish I didn't feel dumb.
eta: and if NY is having a decline in hospital admissions, why do they still need 50 million ventilators/beds?
Thanks for any insight -- I stink at reading most of these things.
This post was edited on 3/31/20 at 8:58 am
Posted on 3/31/20 at 8:55 am to Chromdome35
Posted on 3/31/20 at 8:59 am to Tiguar

Posted on 3/31/20 at 9:00 am to tiger91
I lost it at the china part
Posted on 3/31/20 at 9:03 am to Tiguar
Yeah thankful I didn't wake my people up with my lol.
Posted on 3/31/20 at 9:04 am to tiger91
quote:
Can someone help with a question about that website that has the "days until peak" info?
On Sunday the peak for Louisiana (my state ugh) said 8 days. Yesterday it said 10 days.
If the "days until peak" keeps getting moved, will "leaders" keep moving the end of "stay home" back? The point of doing what we're doing is to NOT reach a peak for resources.
eta: and if NY is having a decline in hospital admissions, why do they still need 50 million ventilators/beds?
Thanks for any insight -- I stink at reading most of these things.
I assume you're talking about this.
It's the University of Washington/IHME projections laid out in modeling form. It's basically taking the projections that the IHME made a week (or so?) ago and slapping on actual data on top of it to fit into where they think the state or country should be. It's a bit counter-intuitive, but lower case counts and lower death counts seem to be flattening but widening the curves.
As an example, Washington state's make absolutely no sense to me and the projections are already off by quite a bit. Hospitalizations declined last week there, and deaths have gone down three days in a row, yet it's predicting that the hospitalization and death peaks don't come for another three weeks.
It's just a model, and like all models, it's only as good as its inputs. A lot of public leaders seem to be making decisions off this particular UW model (the VA governor, as an example) at the moment, just like a bunch were basing decisions off the ICL model two weeks ago. More refined data will enable better decision-making as the days tick on.
This post was edited on 3/31/20 at 9:07 am
Posted on 3/31/20 at 9:09 am to Tiguar
LOL, thats awesome!
Posted on 3/31/20 at 9:14 am to Chromdome35
China. 
Posted on 3/31/20 at 9:19 am to AbuTheMonkey
quote:
It's just a model, and like all models, it's only as good as its inputs. A lot of public leaders seem to be making decisions off this particular UW model (the VA governor, as an example) at the moment, just like a bunch were basing decisions off the ICL model two weeks ago. More refined data will enable better decision-making as the days tick on.
Yes that one and I'm hoping that the "date to peak" moving back won't be used alone when state leaders make decisions about the stay home orders for their state. Our governor has been somewhat calm with all of this but I don't trust him. Can't tell you why but he's just ugh.
Posted on 3/31/20 at 9:27 am to Tiguar
Holy shite
This post was edited on 3/31/20 at 9:27 am
Posted on 3/31/20 at 9:53 am to nerd guy
Less than 800,000 on a planet which is occupied by 7+ billion human beings
Posted on 3/31/20 at 10:03 am to Chromdome35
quote:
i check for this chart every day. i am wrong for thinking the clear downward slope since 3/19/2020 is extremely promising? the growth rate is trending towards 0.0% (eventually) which indicates the curve is in fact flattened?
Posted on 3/31/20 at 10:07 am to Winston Cup
It is a very good sign. This chart is a logarithmic graph of total cases, you can see that the curve is starting to flatten as a result of the declining growth rate.

Posted on 3/31/20 at 10:10 am to AbuTheMonkey
I think that chart(as is a lot of the data on this)very unreliable. Sunday, it had Mississippi peaking on April 23rd and calling for 768 deaths by August 4. Yesterday, it still had us peaking on 4-23, but deaths by 8-4 jumped to over 2,200 by far more than any southern state. Today, it has the peak at 4-22, and deaths are now projected at 1,223 by 8-4. That's some big swings daily. I would have no confidence in a governor/politician basing policies off that crap.
This post was edited on 3/31/20 at 10:12 am
Posted on 3/31/20 at 10:11 am to Winston Cup
It is a very positive sign. That is why the states are trying to prevent a spike. Hence why Texas and Florida are doing what they are doing to travelers. People may not like it but the states we gotta get this shite over soon so we can get goiong back to normal as a society asap.
Posted on 3/31/20 at 10:16 am to uppermidwestbama
Posted on 3/31/20 at 10:17 am to msudawg1200
quote:
I think that chart(as is a lot of the data on this)very unreliable. Sunday, it had Mississippi peaking on April 23rd and calling for 768 deaths by August 4. Yesterday, it still had us peaking on 4-23, but deaths by 8-4 jumped to over 2,200 by far more than any southern state. Today, it has the peak at 4-22, and deaths are now projected at 1,223 by 8-4. That's some big swings daily.
Yea, the daily fluctuations at the state level are going to be all over the place. If I had to guess, it's probably a little closer to what the truth will be on the macro (national) level, though I am starting to think 80,000 deaths is definitely on the high end; mid-April does sound about right for national peak stress on the system, though. The problem with the way it is set up is that minor variations in deaths or reported cases will cause huge fluctuations in timing, hospitalizations, deaths, etc. at the state level.
quote:
That's some big swings daily. I would have no confidence in a governor/politician basing policies off that crap.
Well, do I have some news for you, bud. They are. It's like that Collins County judge who was throwing up graphs from the Covid model that a bunch of tech bros built a few weeks ago trying to scare the shite out of his constituency. One of the less beautiful things about the information age is that these leaders are flying as blind as the rest of us.
Posted on 3/31/20 at 10:25 am to AbuTheMonkey
quote:
Well, do I have some news for you, bud. They are. It's like that Collins County judge who was throwing up graphs from the Covid model that a bunch of tech bros built a few weeks ago trying to scare the shite out of his constituency. One of the less beautiful things about the information age is that these leaders are flying as blind as the rest of
us
Oh, no doubt. Some leaders have used that covidactnow.com which was calling for 1-2 million U.S. deaths at one time. I think that's the one you are talking about. You are correct about the Information Age. To much information and not enough knowledge if that makes sense.
Posted on 3/31/20 at 10:40 am to msudawg1200
(no message)
This post was edited on 3/31/20 at 10:47 am

 Page 105 of 331



Popular

Back to top
 Follow TigerDroppings for LSU Football News