




 0
0













- My Forums
- Tiger Rant
- LSU Recruiting
- SEC Rant
- Saints Talk
- Pelicans Talk
- More Sports Board
- Fantasy Sports
- Golf Board
- Soccer Board
- O-T Lounge
- Tech Board
- Home/Garden Board
- Outdoor Board
- Health/Fitness Board
- Movie/TV Board
- Book Board
- Music Board
- Political Talk
- Money Talk
- Fark Board
- Gaming Board
- Travel Board
- Food/Drink Board
- Ticket Exchange
- TD Help Board
Customize My Forums- View All Forums
- Show Left Links
- Topic Sort Options
- Trending Topics
- Recent Topics
- Active Topics
Started By
Message
re: Daily COVID Updated as of 11/2/20 8:00 PM
Posted on 3/30/20 at 5:05 pm to Tiguar
Posted on 3/30/20 at 5:05 pm to Tiguar
quote:
I still have some hope we wont get above 2k/day
Same, but looking at the models, unless we have some major contamination breaches, I think it's trending towards that 2500 figure.
Posted on 3/30/20 at 5:06 pm to Chromdome35
This is the link to the COVID-19 tracker that I have shared on Google Drive. Chromdome's COVID-19 Daily Tracker
The source for the data is https://www.worldometers.info/coronavirus/
The source for the testing data is from https://covidtracking.com/data/
On the tracker sheet you will see tabs for the following data:
1) US Summary
2) Country Comparables: This shows you how the US stacks up vs. select other countries dealing with COVID-19
3) Logarithmic Comparisons - Shows the US vs the other countries on the tracker.
4) Covid Vs Other Outbreaks - Compares the current COVID numbers to the last 10 years of flue and H1N1
5) US Weighted Averages - Explores 7 day vs 3 day weight average trends
6) Italy Summary
7) UK Summary
8) France Summary
9) Germany Summary
10) Sweden Summary
11) World Summary
NOTE: The daily growth rate data will not be accurate until the end of the day's postings. It will change throughout the day.
NOTE: I am not tracking individual states, I don't have a reliable consistent source for that data.
NOTE: I am not a mathematician, statistics guru, scientist, sharpest tack in the box, I'm just a guy who likes to understand for myself what is happening and to share it with others. This thread was not created to debate if you should or shouldn't take this seriously, it is simply to present the numbers and foster conversation.
I changed the formating of the numbers in the table to reflect positive movements (Green) vs negative movements (Red). This will allow you to quickly see how the numbers are moving.

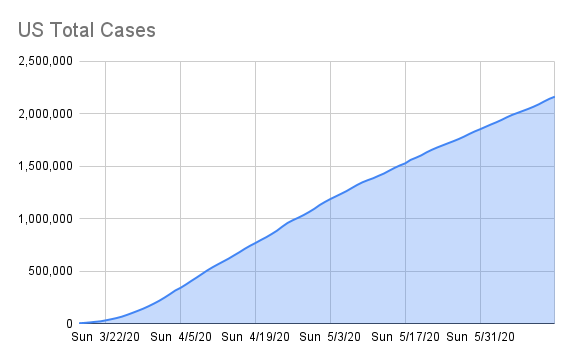



The source for the data is https://www.worldometers.info/coronavirus/
The source for the testing data is from https://covidtracking.com/data/
On the tracker sheet you will see tabs for the following data:
1) US Summary
2) Country Comparables: This shows you how the US stacks up vs. select other countries dealing with COVID-19
3) Logarithmic Comparisons - Shows the US vs the other countries on the tracker.
4) Covid Vs Other Outbreaks - Compares the current COVID numbers to the last 10 years of flue and H1N1
5) US Weighted Averages - Explores 7 day vs 3 day weight average trends
6) Italy Summary
7) UK Summary
8) France Summary
9) Germany Summary
10) Sweden Summary
11) World Summary
NOTE: The daily growth rate data will not be accurate until the end of the day's postings. It will change throughout the day.
NOTE: I am not tracking individual states, I don't have a reliable consistent source for that data.
NOTE: I am not a mathematician, statistics guru, scientist, sharpest tack in the box, I'm just a guy who likes to understand for myself what is happening and to share it with others. This thread was not created to debate if you should or shouldn't take this seriously, it is simply to present the numbers and foster conversation.
I changed the formating of the numbers in the table to reflect positive movements (Green) vs negative movements (Red). This will allow you to quickly see how the numbers are moving.
Posted on 3/30/20 at 5:26 pm to Chromdome35
Can’t post from IG, but there is some frickery from the MSM
LINK
LINK
This post was edited on 3/30/20 at 5:27 pm
Posted on 3/30/20 at 6:18 pm to Spaceman Spiff
124 deaths in NYC today. Don't expect that number to go down for at least a week. Their number of cases is doubling about every 6 days now so it is slowing, but with over 2k still in the ICU's with COVID there will be lots more death being reported in the coming days.
Posted on 3/30/20 at 6:41 pm to Chromdome35
well, It appears yesterday was a weekend anomaly for deaths.
Posted on 3/30/20 at 6:45 pm to Chromdome35
When is the next update?
Posted on 3/30/20 at 6:45 pm to Chromdome35
quote:Yep, it looks like a new high today for daily deaths of 548 with at least one more update tonight before the clock starts over.
It appears yesterday was a weekend anomaly for deaths.

Posted on 3/30/20 at 6:48 pm to Chromdome35
Wonder if that is a reporting issue
Posted on 3/30/20 at 6:50 pm to LSURussian
They have been saying we are not at the peak yet for daily death averages.
The mortality rate for confirmed cases based on current testing standards is close to break the 2 percent mark. In Oregon their death rate is 2.6 percent.
606 positive covid tests in Oregon.
16 deaths.
Georgia Report: 03/30/2020 (19:07:03):
[ ] increase since 11:28:11
Total COVID-19 Confirmed Cases: 3032 [223]
Hospitalized: 773 (25.49%) [66]
Deaths: 102 (3.36%) [15] in 36 counties
Comm Lab 2731 positive [224] / 11562 tests [891]
GPH lab: 301 positives [-1] / 1895 tests [0]
The dcotors will likely be right and we surpass 100k deaths. There are too many people out there that are volunerable to the COVID to not hit lots of death.
The mortality rate for confirmed cases based on current testing standards is close to break the 2 percent mark. In Oregon their death rate is 2.6 percent.
606 positive covid tests in Oregon.
16 deaths.
Georgia Report: 03/30/2020 (19:07:03):
[ ] increase since 11:28:11
Total COVID-19 Confirmed Cases: 3032 [223]
Hospitalized: 773 (25.49%) [66]
Deaths: 102 (3.36%) [15] in 36 counties
Comm Lab 2731 positive [224] / 11562 tests [891]
GPH lab: 301 positives [-1] / 1895 tests [0]
The dcotors will likely be right and we surpass 100k deaths. There are too many people out there that are volunerable to the COVID to not hit lots of death.
Posted on 3/30/20 at 7:24 pm to uppermidwestbama
quote:
too many people out there that are volunerable
What does Tennessee have to do with this?
Posted on 3/30/20 at 7:37 pm to RockyMtnTigerWDE
quote:
What does Tennessee have to do with this?
and....this made me laugh way too loud

Posted on 3/30/20 at 7:38 pm to RockyMtnTigerWDE
The mortality percent will raise as new cases slow. Simple math.
Posted on 3/30/20 at 7:40 pm to uppermidwestbama
quote:
we surpass 100k deaths
No chance.
Posted on 3/30/20 at 8:00 pm to LSURussian
Upsetting
Posted on 3/30/20 at 8:06 pm to Chromdome35
This is the link to the COVID-19 tracker that I have shared on Google Drive. Chromdome's COVID-19 Daily Tracker
The source for the data is https://www.worldometers.info/coronavirus/
The source for the testing data is from https://covidtracking.com/data/
On the tracker sheet you will see tabs for the following data:
1) US Summary
2) Country Comparables: This shows you how the US stacks up vs. select other countries dealing with COVID-19
3) Logarithmic Comparisons - Shows the US vs the other countries on the tracker.
4) Covid Vs Other Outbreaks - Compares the current COVID numbers to the last 10 years of flue and H1N1
5) US Weighted Averages - Explores 7 day vs 3 day weight average trends
6) Italy Summary
7) UK Summary
8) France Summary
9) Germany Summary
10) Sweden Summary
11) World Summary
NOTE: The daily growth rate data will not be accurate until the end of the day's postings. It will change throughout the day.
NOTE: I am not tracking individual states, I don't have a reliable consistent source for that data.
NOTE: I am not a mathematician, statistics guru, scientist, sharpest tack in the box, I'm just a guy who likes to understand for myself what is happening and to share it with others. This thread was not created to debate if you should or shouldn't take this seriously, it is simply to present the numbers and foster conversation.
I changed the formating of the numbers in the table to reflect positive movements (Green) vs negative movements (Red). This will allow you to quickly see how the numbers are moving.

The source for the data is https://www.worldometers.info/coronavirus/
The source for the testing data is from https://covidtracking.com/data/
On the tracker sheet you will see tabs for the following data:
1) US Summary
2) Country Comparables: This shows you how the US stacks up vs. select other countries dealing with COVID-19
3) Logarithmic Comparisons - Shows the US vs the other countries on the tracker.
4) Covid Vs Other Outbreaks - Compares the current COVID numbers to the last 10 years of flue and H1N1
5) US Weighted Averages - Explores 7 day vs 3 day weight average trends
6) Italy Summary
7) UK Summary
8) France Summary
9) Germany Summary
10) Sweden Summary
11) World Summary
NOTE: The daily growth rate data will not be accurate until the end of the day's postings. It will change throughout the day.
NOTE: I am not tracking individual states, I don't have a reliable consistent source for that data.
NOTE: I am not a mathematician, statistics guru, scientist, sharpest tack in the box, I'm just a guy who likes to understand for myself what is happening and to share it with others. This thread was not created to debate if you should or shouldn't take this seriously, it is simply to present the numbers and foster conversation.
I changed the formating of the numbers in the table to reflect positive movements (Green) vs negative movements (Red). This will allow you to quickly see how the numbers are moving.
Posted on 3/30/20 at 8:08 pm to Chromdome35
I will update once more when the final numbers are in for the day.
Posted on 3/30/20 at 8:09 pm to Chromdome35
Any chance some of this is rollover from the weekend?
Posted on 3/30/20 at 8:11 pm to Janky
It certainly could be. Those numbers had to go somewhere.
Posted on 3/30/20 at 8:14 pm to Chromdome35
Hopefully tomorrow will be lower so this is just an anomaly.
Posted on 3/30/20 at 8:15 pm to Janky
quote:
Any chance some of this is rollover from the weekend?
Decent. Which is why the log total deaths graph is more important, IMO.

 Page 103 of 331



Popular

Back to top
 Follow TigerDroppings for LSU Football News