- My Forums
- Tiger Rant
- LSU Recruiting
- SEC Rant
- Saints Talk
- Pelicans Talk
- More Sports Board
- Fantasy Sports
- Golf Board
- Soccer Board
- O-T Lounge
- Tech Board
- Home/Garden Board
- Outdoor Board
- Health/Fitness Board
- Movie/TV Board
- Book Board
- Music Board
- Political Talk
- Money Talk
- Fark Board
- Gaming Board
- Travel Board
- Food/Drink Board
- Ticket Exchange
- TD Help Board
Customize My Forums- View All Forums
- Show Left Links
- Topic Sort Options
- Trending Topics
- Recent Topics
- Active Topics
Started By
Message
A Look at the Annual Performance of the S&P 500 2009-Present
Posted on 9/30/19 at 7:01 am
Posted on 9/30/19 at 7:01 am
quote:
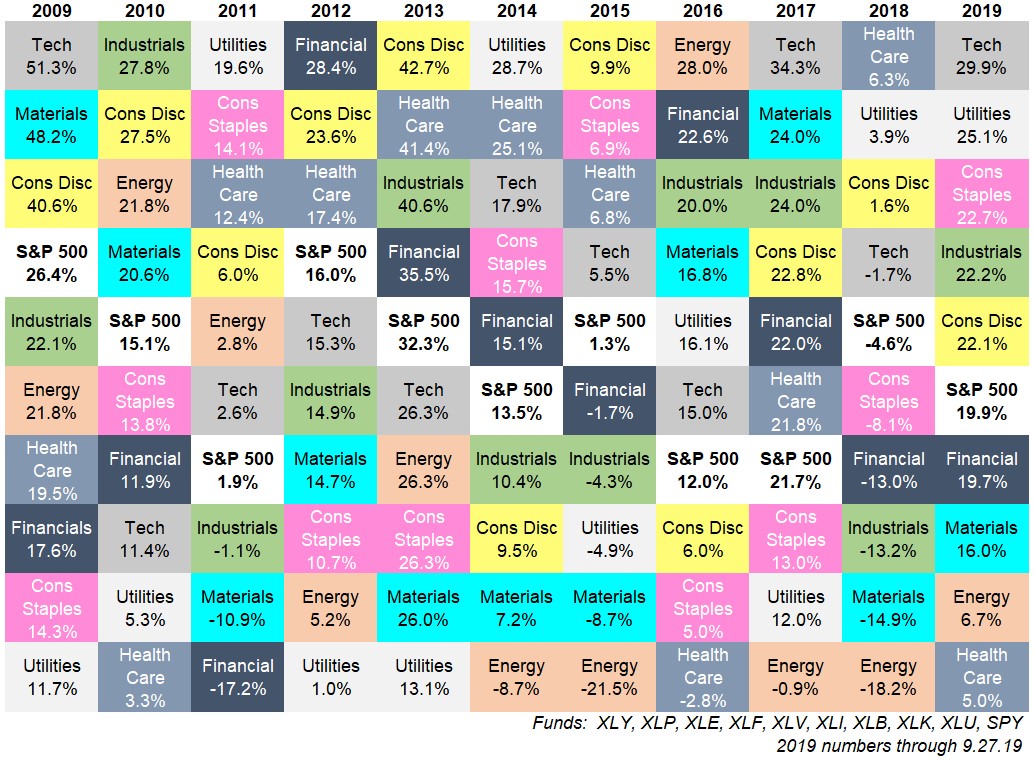
Here’s a look at the annual performance of the various sectors in the S&P 500 going back to 2009 using the State Street sector ETFs:
quote:
It’s surprising the consumer discretionary sector (XLY) is the best performer. I was sure it would be the tech sector (XLK). But this makes more sense when you consider Amazon makes up more than 20% of XLY
quote:
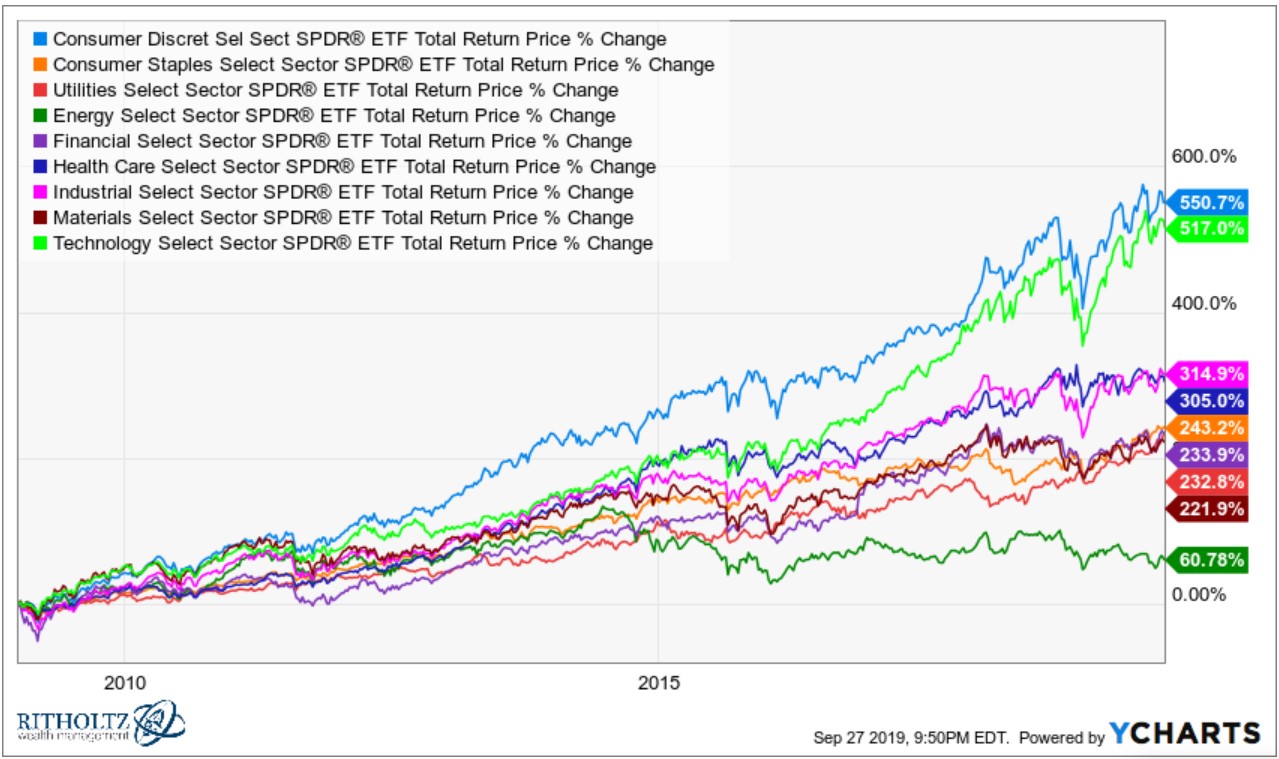
Energy stocks are down by more than 20% while the S&P 500 is up nearly 80% in total.1
quote:
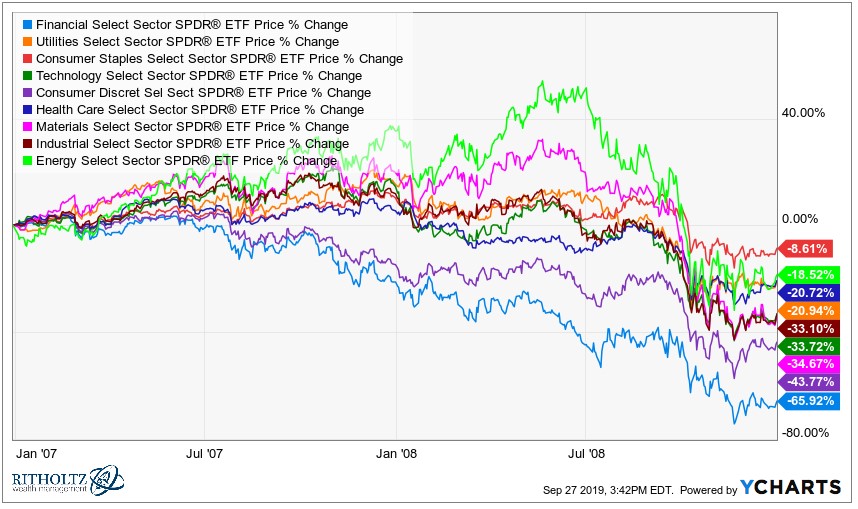
Beaten down sectors don’t always offer a fat pitch. Financials were the worst performers from 2007-2008 by a wide margin
quote:
Picking the right sector requires more than simply picking the best sector. You can be the best stock-picker in the world but if you choose the wrong sector you’re out of luck.
Or you could pick the best sectors but if you choose the wrong geography then you’re out of luck.
Or you could pick the best geography to be in but if you choose the wrong asset class then you’re out of luck.
LINK
Key Takeaway: Don’t pick individual stocks, sectors, asset class, or geography. Buy the whole market for the best returns.
This post was edited on 9/30/19 at 7:02 am
 5
5


Posted on 9/30/19 at 9:27 am to OleWarSkuleAlum
quote:
Key Takeaway: Don’t pick individual stocks, sectors, asset class, or geography. Buy the whole market for the best returns.
So you're saying I should diversify?
Typical. First they tell you to diversify then before you know it they're telling you not to time the market.
Posted on 9/30/19 at 9:40 am to OleWarSkuleAlum
The Dow Jones Rail Road Index (DJUSRR) is up 797% over the last 10.5 years. That's right, old school, boring railroads have outperformed Tech over the last 10 years.
Posted on 9/30/19 at 9:42 am to OleWarSkuleAlum
This is called a jellybean chart, and tells you that you don’t know shite
Posted on 10/1/19 at 12:21 pm to OleWarSkuleAlum
Industrials and consumer discretionary have never been on the bottom.
Here’s my takeaway,
Put 80% into sp500 and 20% in either consumer discretionary or industrials and you’ll beat the market
Here’s my takeaway,
Put 80% into sp500 and 20% in either consumer discretionary or industrials and you’ll beat the market
Posted on 10/1/19 at 12:24 pm to SlidellCajun
quote:
Put 80% into sp500 and 20% in either consumer discretionary or industrials and you’ll beat the market
Changed your tune since yesterday?
Posted on 10/2/19 at 11:31 am to Thib-a-doe Tiger
Based on the chart, it looks like a good strategy.
You disagree?
You disagree?
This post was edited on 10/2/19 at 11:34 am
Posted on 10/2/19 at 1:45 pm to OleWarSkuleAlum
quote:
Energy stocks down more than 20%
As someone in O&G, this is fine...this is fine...

Posted on 10/2/19 at 1:56 pm to Boring
Haha

 Page 1 of 1


Popular
Back to top