




 0
0



- My Forums
- Tiger Rant
- LSU Score Board
- LSU Recruiting
- SEC Rant
- SEC Score Board
- Saints Talk
- Pelicans Talk
- More Sports Board
- Fantasy Sports
- Golf Board
- Soccer Board
- O-T Lounge
- Tech Board
- Home/Garden Board
- Outdoor Board
- Health/Fitness Board
- Movie/TV Board
- Book Board
- Music Board
- Political Talk
- Money Talk
- Fark Board
- Gaming Board
- Travel Board
- Food/Drink Board
- Ticket Exchange
- TD Help Board
Customize My Forums- View All Forums
- Show Left Links
- Topic Sort Options
- Trending Topics
- Recent Topics
- Active Topics
Started By
Message
re: Daily COVID Updated as of 11/2/20 8:00 PM
Posted on 4/14/20 at 5:29 pm to Chromdome35
Posted on 4/14/20 at 5:29 pm to Chromdome35
Hey, that's a mighty fine chart!
Posted on 4/14/20 at 5:30 pm to buckeye_vol
quote:I don't follow the reasoning for this.
FYI. For a moving average of times series data, there should be an equal amount of days on either side of the day calculated by the average, instead of the 7 days leading up to the final day.
For example, if you do a 7 day moving average, the 4th day would be the midpoint, so then it should start on Day 4 and end on the 4th to last day (e.g., Saturday would be the midpoint through today).
Posted on 4/14/20 at 5:38 pm to buckeye_vol
I understand what you are describing; however, I don't understand why it should be done that way. I'm not saying it's not correct, I've just never seen it done like that.
Typically rolling averages are used as a "forecast" for the future, the method you're describing would only be useful X number of days after the fact.
Typically rolling averages are used as a "forecast" for the future, the method you're describing would only be useful X number of days after the fact.
This post was edited on 4/14/20 at 5:43 pm
Posted on 4/14/20 at 5:42 pm to AthensTiger
Thanks Athens
Posted on 4/14/20 at 5:46 pm to Chromdome35
quote:
Thanks Kid, fixed it!
Awesome. Thanks.
Posted on 4/14/20 at 6:01 pm to Chromdome35
quote:Moving averages lag, so as I understand it the purpose of his suggestion is simply to align the average in time with the underlying values. It just gives a better indication of the trend at that point in time. This might only be true of a simple moving average, though.
I understand what you are describing; however, I don't understand why it should be done that way.
Personally, I don't think it matters much for this purpose.
Posted on 4/14/20 at 6:02 pm to Chromdome35
Just saw this nice little gem for worldometers
These 3k extra deaths never had covid but we need to add them to the numbers. Stay tuned.

quote:
24215 new cases and 2284 new deaths in the United States
New York City today has reported 3,778 additional deaths that have occurred since March 11 and have been classified as "probable," defined as follows: “decedent [...] had no known positive laboratory test for SARS-CoV-2 (COVID-19) but the death certificate lists as a cause of death “COVID-19” or an equivalent" [source]. We will add these to the New York State total as soon as it is determined whether the historical distribution can be obtained
These 3k extra deaths never had covid but we need to add them to the numbers. Stay tuned.
This post was edited on 4/14/20 at 6:03 pm
Posted on 4/14/20 at 6:04 pm to TigerMan327
This is a perfect example of what I said not far back in the thread. One of the biggest takeaways from this needs to be a much tighter data acquisition protocol.
Posted on 4/14/20 at 6:14 pm to TigerMan327
quote:So now we think they're telling us exactly how many deaths are fraudulent? Bold strategy, Cotton.
These 3k extra deaths never had covid but we need to add them to the numbers. Stay tuned.
Posted on 4/14/20 at 6:27 pm to Korkstand
Did they include Epstein?
Posted on 4/14/20 at 6:38 pm to GaDawg9977
If you guys researched various states you would know how the reporting works. There is no "over rolling". The numbers simply fluctuate since not all counties report on the same day. In California there are a lot of counties that don't report during the weekend. So there is a Monday report that includes Saturday and Sunday.
Some states all counties report on the same day.
This isn't complex folks.
Some states all counties report on the same day.
This isn't complex folks.
Posted on 4/14/20 at 6:40 pm to uppermidwestbama
Nearing the end of the day and the confirmed cases could finish right around yesterday (above or below). We will see what the final number is but things are looking great.
Posted on 4/14/20 at 6:45 pm to buckeye_vol
It looks like the numbers are going to finish pretty close to what you predicted.
quote:
Just note, I’m not predicting 2,451+ deaths on Tuesday, I’m predicting that the total deaths on Tuesday are much lower, but 500+ deaths are a result of an under reporting from Saturday-Monday.
Posted on 4/14/20 at 6:46 pm to Chromdome35
True. I’ll admit I thought the 2400 number was quite a bit too high but Buckeye looks like he about nailed it.
Posted on 4/14/20 at 6:50 pm to ValDawgsta
As I said last night, the data didn't support 2,500 deaths. And we aren't hitting that today. I would still argue we may not have peaked in deaths yet for a one day total. We still have a week to go before the 14ish day period to hit from our peak of case numbers.
Posted on 4/14/20 at 8:21 pm to Chromdome35
This is the link to the US state level tracker that I have shared via Google Drive. Chromdome's State Level COVID-19 Daily Tracker
This is the link to the COVID-19 Country tracker that I have shared on Google Drive. Chromdome's COVID-19 Daily Tracker
On the state level tracker the states I have available right now are listed below. I will be adding additional states in the coming days.
Arkansas, Louisiana, New York, Georgia, Florida, California
The source for the data is https://www.worldometers.info/coronavirus/
The source for the testing data is from https://covidtracking.com/data/
On the tracker sheet you will see tabs for the following data:
1) US Summary
2) Country Comparables: This shows you how the US stacks up vs. select other countries dealing with COVID-19
3) Logarithmic Comparisons - Shows the US vs the other countries on the tracker.
4) Covid Vs Other Outbreaks - Compares the current COVID numbers to the last 10 years of flue and H1N1
5) US Weighted Averages - Explores 7 day vs 3 day weight average trends
6) Italy Summary
7) UK Summary
8) France Summary
9) Germany Summary
10) Sweden Summary
11) World Summary
NOTE: The daily growth rate data will not be accurate until the end of the day's postings. It will change throughout the day.
NOTE: I am not tracking individual states, I don't have a reliable consistent source for that data.
NOTE: I am not a mathematician, statistics guru, scientist, sharpest tack in the box, I'm just a guy who likes to understand for myself what is happening and to share it with others. This thread was not created to debate if you should or shouldn't take this seriously, it is simply to present the numbers and foster conversation.
NOTE: I have added a prediction number to the bottom of the data grid. This simply takes the previous days numbers and grows them at the previous day's growth rate. It should give the viewer some idea of what the numbers will look like today. Obviously, the final number for the day will be higher or lower based on what today's growth rate actualy is. This is just a simple indicator.




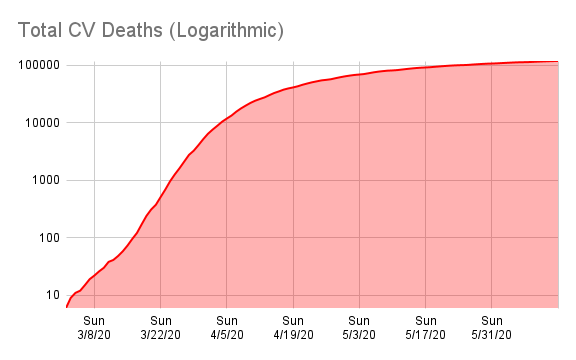


This is the link to the COVID-19 Country tracker that I have shared on Google Drive. Chromdome's COVID-19 Daily Tracker
On the state level tracker the states I have available right now are listed below. I will be adding additional states in the coming days.
Arkansas, Louisiana, New York, Georgia, Florida, California
The source for the data is https://www.worldometers.info/coronavirus/
The source for the testing data is from https://covidtracking.com/data/
On the tracker sheet you will see tabs for the following data:
1) US Summary
2) Country Comparables: This shows you how the US stacks up vs. select other countries dealing with COVID-19
3) Logarithmic Comparisons - Shows the US vs the other countries on the tracker.
4) Covid Vs Other Outbreaks - Compares the current COVID numbers to the last 10 years of flue and H1N1
5) US Weighted Averages - Explores 7 day vs 3 day weight average trends
6) Italy Summary
7) UK Summary
8) France Summary
9) Germany Summary
10) Sweden Summary
11) World Summary
NOTE: The daily growth rate data will not be accurate until the end of the day's postings. It will change throughout the day.
NOTE: I am not tracking individual states, I don't have a reliable consistent source for that data.
NOTE: I am not a mathematician, statistics guru, scientist, sharpest tack in the box, I'm just a guy who likes to understand for myself what is happening and to share it with others. This thread was not created to debate if you should or shouldn't take this seriously, it is simply to present the numbers and foster conversation.
NOTE: I have added a prediction number to the bottom of the data grid. This simply takes the previous days numbers and grows them at the previous day's growth rate. It should give the viewer some idea of what the numbers will look like today. Obviously, the final number for the day will be higher or lower based on what today's growth rate actualy is. This is just a simple indicator.
Posted on 4/14/20 at 8:25 pm to Cosmo
We can now go back to 4/9 to 4/14 and finally say we have a trend developing for a decrease in new cases.
We still need to see that happen throughout the week (some days higher and some days lower) before we have a sustained trend.

Testing numbers at a much higher level than yesterday and not much of a difference in new cases confirmed.
We still need to see that happen throughout the week (some days higher and some days lower) before we have a sustained trend.
Testing numbers at a much higher level than yesterday and not much of a difference in new cases confirmed.
Posted on 4/14/20 at 8:27 pm to Chromdome35
The number of new cases remained flat from yesterday, Deaths increased dramatically continuing the trend of large Tuesday updates after depressed weekend numbers.
Testing jumped up to 156K tests today and for the first time in a long time, the % of positive tests fell, landing at 16.5% on the day. This is below the cumulative average of 19.6%. Hopefully, this will turn into a new trend.
Mortality continues to climb and is now at 4.24%.
We anticipated the bump today, what will really tell us more though is what we see over the next 3 days in terms of a decline in deaths...If deaths decline, then we can truly say we've seen the peak and are on the way to getting back to work.
Testing jumped up to 156K tests today and for the first time in a long time, the % of positive tests fell, landing at 16.5% on the day. This is below the cumulative average of 19.6%. Hopefully, this will turn into a new trend.
Mortality continues to climb and is now at 4.24%.
We anticipated the bump today, what will really tell us more though is what we see over the next 3 days in terms of a decline in deaths...If deaths decline, then we can truly say we've seen the peak and are on the way to getting back to work.
This post was edited on 4/14/20 at 8:28 pm
Posted on 4/14/20 at 8:34 pm to TigerMan327
quote:Based on decades worth of deaths data, New York City was expected to have 4450 deaths for the month ending on April 4th. There were 9780 deaths, which means there were 5330 MORE DEATHS (excess mortality) than expected.
These 3k extra deaths never had covid but we need to add them to the numbers. Stay tuned.
There were only 3350 deaths as a result of COVID-19 at that time, with an excess of 1980 deaths above the expected death total AND including the COVID-19 deaths. Those are likely a result of COVID-19. That indicates that nearly 60% more deaths are a result of COVID-19 than recorded.
These as we he type of data that the CDC will use to estimates the true number of fatalities due to COVID-19, just like they did with the seasonal flu. For example, H1N1 deaths estimates were 4 times higher than the case confirmed deaths.

This post was edited on 4/14/20 at 8:41 pm
Posted on 4/14/20 at 8:36 pm to Chromdome35
With the huge caveat that one day numbers shouldn’t ever be over emphasized, I’d love to see tomorrow have a new case total under 26,619. Simply for the fact that that would be fewer new cases than two weeks prior 4/1.
It’d also be the fewest single day total in April (other than 4/5 which was a Sunday).
Cheering like hell for some more bending in this mofo!
It’d also be the fewest single day total in April (other than 4/5 which was a Sunday).
Cheering like hell for some more bending in this mofo!

 Page 175 of 331



Popular

Back to top
 Follow TigerDroppings for LSU Football News