





 1
1






- My Forums
- Tiger Rant
- LSU Recruiting
- SEC Rant
- Saints Talk
- Pelicans Talk
- More Sports Board
- Fantasy Sports
- Golf Board
- Soccer Board
- O-T Lounge
- Tech Board
- Home/Garden Board
- Outdoor Board
- Health/Fitness Board
- Movie/TV Board
- Book Board
- Music Board
- Political Talk
- Money Talk
- Fark Board
- Gaming Board
- Travel Board
- Food/Drink Board
- Ticket Exchange
- TD Help Board
Customize My Forums- View All Forums
- Show Left Links
- Topic Sort Options
- Trending Topics
- Recent Topics
- Active Topics
Started By
Message
re: Daily COVID Updated as of 11/2/20 8:00 PM
Posted on 3/31/20 at 2:13 pm to HailHailtoMichigan!
Posted on 3/31/20 at 2:13 pm to HailHailtoMichigan!
im gonna take an optimistic approach and say reporting is a constant thing with more focus every day and a lot of reports from high concentration areas are coming in sooner, or earlier in the day.
Posted on 3/31/20 at 2:26 pm to Winston Cup
Posted on 3/31/20 at 2:35 pm to Tiguar
quote:
so far on this site
LINK
alabama is on the very low end range of the prediction as of 3/31
I was just looking at that just a minute ago. A lot of states - the ones that are publishing hospitalizations, if accurate - are on the very low end of the hospitalization ranges and some are below the confidence intervals.
Tennessee was supposed to have 900 hospitalizations and 200 in the ICU yesterday. They have fewer than ~150 hospitalized in total. Texas was another one that was way under the projections.
Extrapolating the UW model to individual states seems to be a bit of a fool's errand right now.
Posted on 3/31/20 at 2:42 pm to Tiguar
I dont wanna jinx us but we're at 17k right now and NJ+CA are in with unimpressive noon numbers. MI hasnt reported anything yet but we may keep the day to only a 20-25% growth rate which would be a big deal on a tuesday where you kinda expect a weekend backlog to show
Posted on 3/31/20 at 2:43 pm to Chromdome35
So I've started compiling state-level data.
Since this is primarily an SEC focused site, I plan to do it for all the member states of the SEC and a few other select states. (I don't have the time or energy to do it for all states). The first state I did was Louisiana.
I am going to publish these in a different workbook
https://docs.google.com/spreadsheets/d/e/2PACX-1vQl5ZpXAHFSHf81pRhZNNa6zfcNVt-It_CcZBleCPx4K6nmgNaxxdp2lkN24af9wCjjYb2jkXZoTNo0/pubhtml

I'm using the WoM for numbers going forward; however, I had to use the COVID Tracking site to get the historical state numbers.
Since this is primarily an SEC focused site, I plan to do it for all the member states of the SEC and a few other select states. (I don't have the time or energy to do it for all states). The first state I did was Louisiana.
I am going to publish these in a different workbook
https://docs.google.com/spreadsheets/d/e/2PACX-1vQl5ZpXAHFSHf81pRhZNNa6zfcNVt-It_CcZBleCPx4K6nmgNaxxdp2lkN24af9wCjjYb2jkXZoTNo0/pubhtml
I'm using the WoM for numbers going forward; however, I had to use the COVID Tracking site to get the historical state numbers.
Posted on 3/31/20 at 3:36 pm to Chromdome35
Please check the description for blue and red axis. Something is fuzzy...
Eta: Blue is cases?
Eta: Blue is cases?
This post was edited on 3/31/20 at 3:37 pm
Posted on 3/31/20 at 3:40 pm to LSURussian
Blue is cases and uses the scale on the left
Red is deaths and uses the scale on the right
Red is deaths and uses the scale on the right
Posted on 3/31/20 at 3:50 pm to Tiguar
He changed the legend. It’s clear now.
Posted on 3/31/20 at 3:51 pm to LSURussian
Sorry about the ambiguity. If you see anything else that I need to fix or add, let me know.
Posted on 3/31/20 at 3:54 pm to Chromdome35
No worries. Thanks for the clarification.
It looks to me Louisiana is still getting worse. Trends are still bad.
Am I wrong?
It looks to me Louisiana is still getting worse. Trends are still bad.
Am I wrong?
Posted on 3/31/20 at 3:59 pm to Chromdome35
This is the link to the COVID-19 tracker that I have shared on Google Drive. Chromdome's COVID-19 Daily Tracker
The source for the data is https://www.worldometers.info/coronavirus/
The source for the testing data is from https://covidtracking.com/data/
On the tracker sheet you will see tabs for the following data:
1) US Summary
2) Country Comparables: This shows you how the US stacks up vs. select other countries dealing with COVID-19
3) Logarithmic Comparisons - Shows the US vs the other countries on the tracker.
4) Covid Vs Other Outbreaks - Compares the current COVID numbers to the last 10 years of flue and H1N1
5) US Weighted Averages - Explores 7 day vs 3 day weight average trends
6) Italy Summary
7) UK Summary
8) France Summary
9) Germany Summary
10) Sweden Summary
11) World Summary
NOTE: The daily growth rate data will not be accurate until the end of the day's postings. It will change throughout the day.
NOTE: I am not tracking individual states, I don't have a reliable consistent source for that data.
NOTE: I am not a mathematician, statistics guru, scientist, sharpest tack in the box, I'm just a guy who likes to understand for myself what is happening and to share it with others. This thread was not created to debate if you should or shouldn't take this seriously, it is simply to present the numbers and foster conversation.

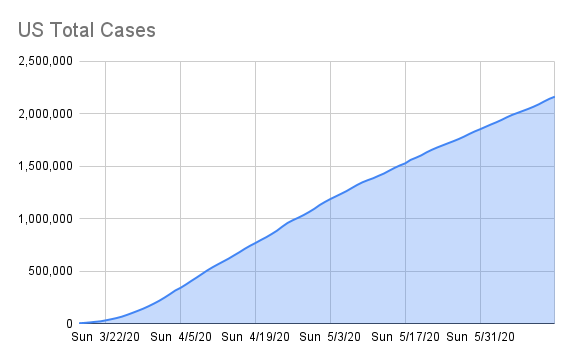



The source for the data is https://www.worldometers.info/coronavirus/
The source for the testing data is from https://covidtracking.com/data/
On the tracker sheet you will see tabs for the following data:
1) US Summary
2) Country Comparables: This shows you how the US stacks up vs. select other countries dealing with COVID-19
3) Logarithmic Comparisons - Shows the US vs the other countries on the tracker.
4) Covid Vs Other Outbreaks - Compares the current COVID numbers to the last 10 years of flue and H1N1
5) US Weighted Averages - Explores 7 day vs 3 day weight average trends
6) Italy Summary
7) UK Summary
8) France Summary
9) Germany Summary
10) Sweden Summary
11) World Summary
NOTE: The daily growth rate data will not be accurate until the end of the day's postings. It will change throughout the day.
NOTE: I am not tracking individual states, I don't have a reliable consistent source for that data.
NOTE: I am not a mathematician, statistics guru, scientist, sharpest tack in the box, I'm just a guy who likes to understand for myself what is happening and to share it with others. This thread was not created to debate if you should or shouldn't take this seriously, it is simply to present the numbers and foster conversation.
Posted on 3/31/20 at 4:05 pm to Chromdome35
Case growth is looking great now after giving us a scare
Posted on 3/31/20 at 4:10 pm to Tiguar
quote:
Case growth is looking great now after giving us a scare
20k cases with 1/3 of the day left is good?
Posted on 3/31/20 at 4:10 pm to Rebel
12% case growth rate is good
we may end the day with the same or maybe even a little less of a growth rate on a day we sometimes see weekend backlog counted
we may end the day with the same or maybe even a little less of a growth rate on a day we sometimes see weekend backlog counted
This post was edited on 3/31/20 at 4:12 pm
Posted on 3/31/20 at 4:12 pm to Chromdome35
I believe the “Daily Growth Rate of New CV Cases” for 3/31 needs your attention.
Posted on 3/31/20 at 4:13 pm to LSURussian
Which data set, US, Louisiana ?
Posted on 3/31/20 at 4:14 pm to Tiguar
quote:There is at least one more update today before we know the final new cases number & percent.
12% case growth rate is good
Posted on 3/31/20 at 4:15 pm to Chromdome35
U.S. Sorry. Eta: you fixed it.
This post was edited on 3/31/20 at 4:16 pm
Posted on 3/31/20 at 4:16 pm to LSURussian
I am aware, I've been following his charts since the start of the thread.
hopefully there won't be a rush of cases at the end
hopefully there won't be a rush of cases at the end
This post was edited on 3/31/20 at 4:16 pm
Posted on 3/31/20 at 4:16 pm to Chromdome35
quote:You are really putting in some serious time and work here.
Chromdome35
You are the hero we don't deserve


 Page 107 of 331



Popular

Back to top
 Follow TigerDroppings for LSU Football News