- My Forums
- Tiger Rant
- LSU Recruiting
- SEC Rant
- Saints Talk
- Pelicans Talk
- More Sports Board
- Fantasy Sports
- Golf Board
- Soccer Board
- O-T Lounge
- Tech Board
- Home/Garden Board
- Outdoor Board
- Health/Fitness Board
- Movie/TV Board
- Book Board
- Music Board
- Political Talk
- Money Talk
- Fark Board
- Gaming Board
- Travel Board
- Food/Drink Board
- Ticket Exchange
- TD Help Board
Customize My Forums- View All Forums
- Show Left Links
- Topic Sort Options
- Trending Topics
- Recent Topics
- Active Topics
Started By
Message
re: 5 Numbers That Defy the Trump Economy Doomers
Posted on 5/31/26 at 2:59 pm to Powerman
Posted on 5/31/26 at 2:59 pm to Powerman
quote:
Another leading indicator to look at is freight data. It's likely we're in the midst of an industrial revival
It’s become near impossible to get a railcar due to freight demand. The catfish feed mill here hasn’t gotten railcars to bring ingredients in weeks they’ve been having to truck it in from pine bluff.
 0
0


Posted on 5/31/26 at 4:21 pm to Jbird
Allow me to present a contrary view...
All of those are happening due to the continued insane levels of deficit spending by Congress. Here's a fun chart to really see what I'm talking about, it shows year, YoY GDP growth (dollar amount) and the amount of federal deficit (ie: money dumped into the economy by adding to the debt):
2008...--..-...79...--...--..459
2009...---...292...---...1,413
2010...---...571...---...1,294
2011...---...551...---...1,300
2012...---...654...---...1,077
2013...---...627...--...-...680
2014...---...727...--...-...485
2015...---...687...--..--...442
2016...---...510...--...-...585
2017...---...807...-...--...665
2018...-..1,045...--...-...779
2019...---...883...--...-...984
2020...---...186...---...3,132
2021...--..2,327...---..2,775
2022...-...2,326...--...1,376
2023...--..1,714...--...1,695
2024...-...2,109...---..1,830
2025...-...1,590...--...1,780
You can look at that as the marginal utility of deficit dollars (my rudimentary version of ICOR).
For the years not bolded, that means we printed more money than the economy grew by (meaning utility ratio of less than 1:1) and 2022 was a bit of a cheat because a lot of that GDP growth was carryover from the extreme COVID deficits and various consumer debt forbearances. From 1970-2007 there was only one year where that happened. When you are in a fiat currency and your GDP growth cannot keep up with your debt-creation, you get inflation. When the glut of that money is going to the citizenry through NGOs and government programs (everything from Medicare to Section 8), that means that the economy is surviving only on government redistribution of wealth, not through organic growth of industry. Social programs make up ~60% of total spending with funding NGOs making up another ~3%-4%.
When I talk of economic doom and gloom, this is the foundational argument for that stance.
With that said, every one of your points -Every. Single. One.- is completely dependent on not just continued high deficit spending, but the growth of it. This means that if we cut spending, we strongly risk a recession. However, if we don't cut spending, we strongly risk continued inflation growth until inflation growth outpaces deficit spending enough that we go into a recession.
How is that not "doom"?
The problem is that this has been rising since 2022 and it gets worse when you consider that things like bankruptcy, vehicle repossessions, 180+ day delinquencies on credit cards, etc. all serve to lower Household Debt Service. So let's look at those in order of most immediate concern (credit card charge-offs, vehicle repo's, bankruptcies and then home foreclosures).
Credit Cards and other loans
Credit card charge-offs hit historic lows during COVID, so naturally they are going to increase. The problem is they've increased to not only pre-COVID levels but levels we haven't seen since coming down from the GFC-era spike. This is also true in the more general category of all consumer debt.
Vehicle repossessions (spreadsheet from Cox Automotive)
-Since the low of 2021, we've seen not only the amount of repo's grow every year, but a consistent growth in the default rate as well.
Bankruptcy filings
-While still near the historic lows of COVID, they have been consistently growing since 2022 and nearing pre-COVID levels. Since 2022 the increases have been double-digit percentages year-over-year (this is the total number, combining personal and business).
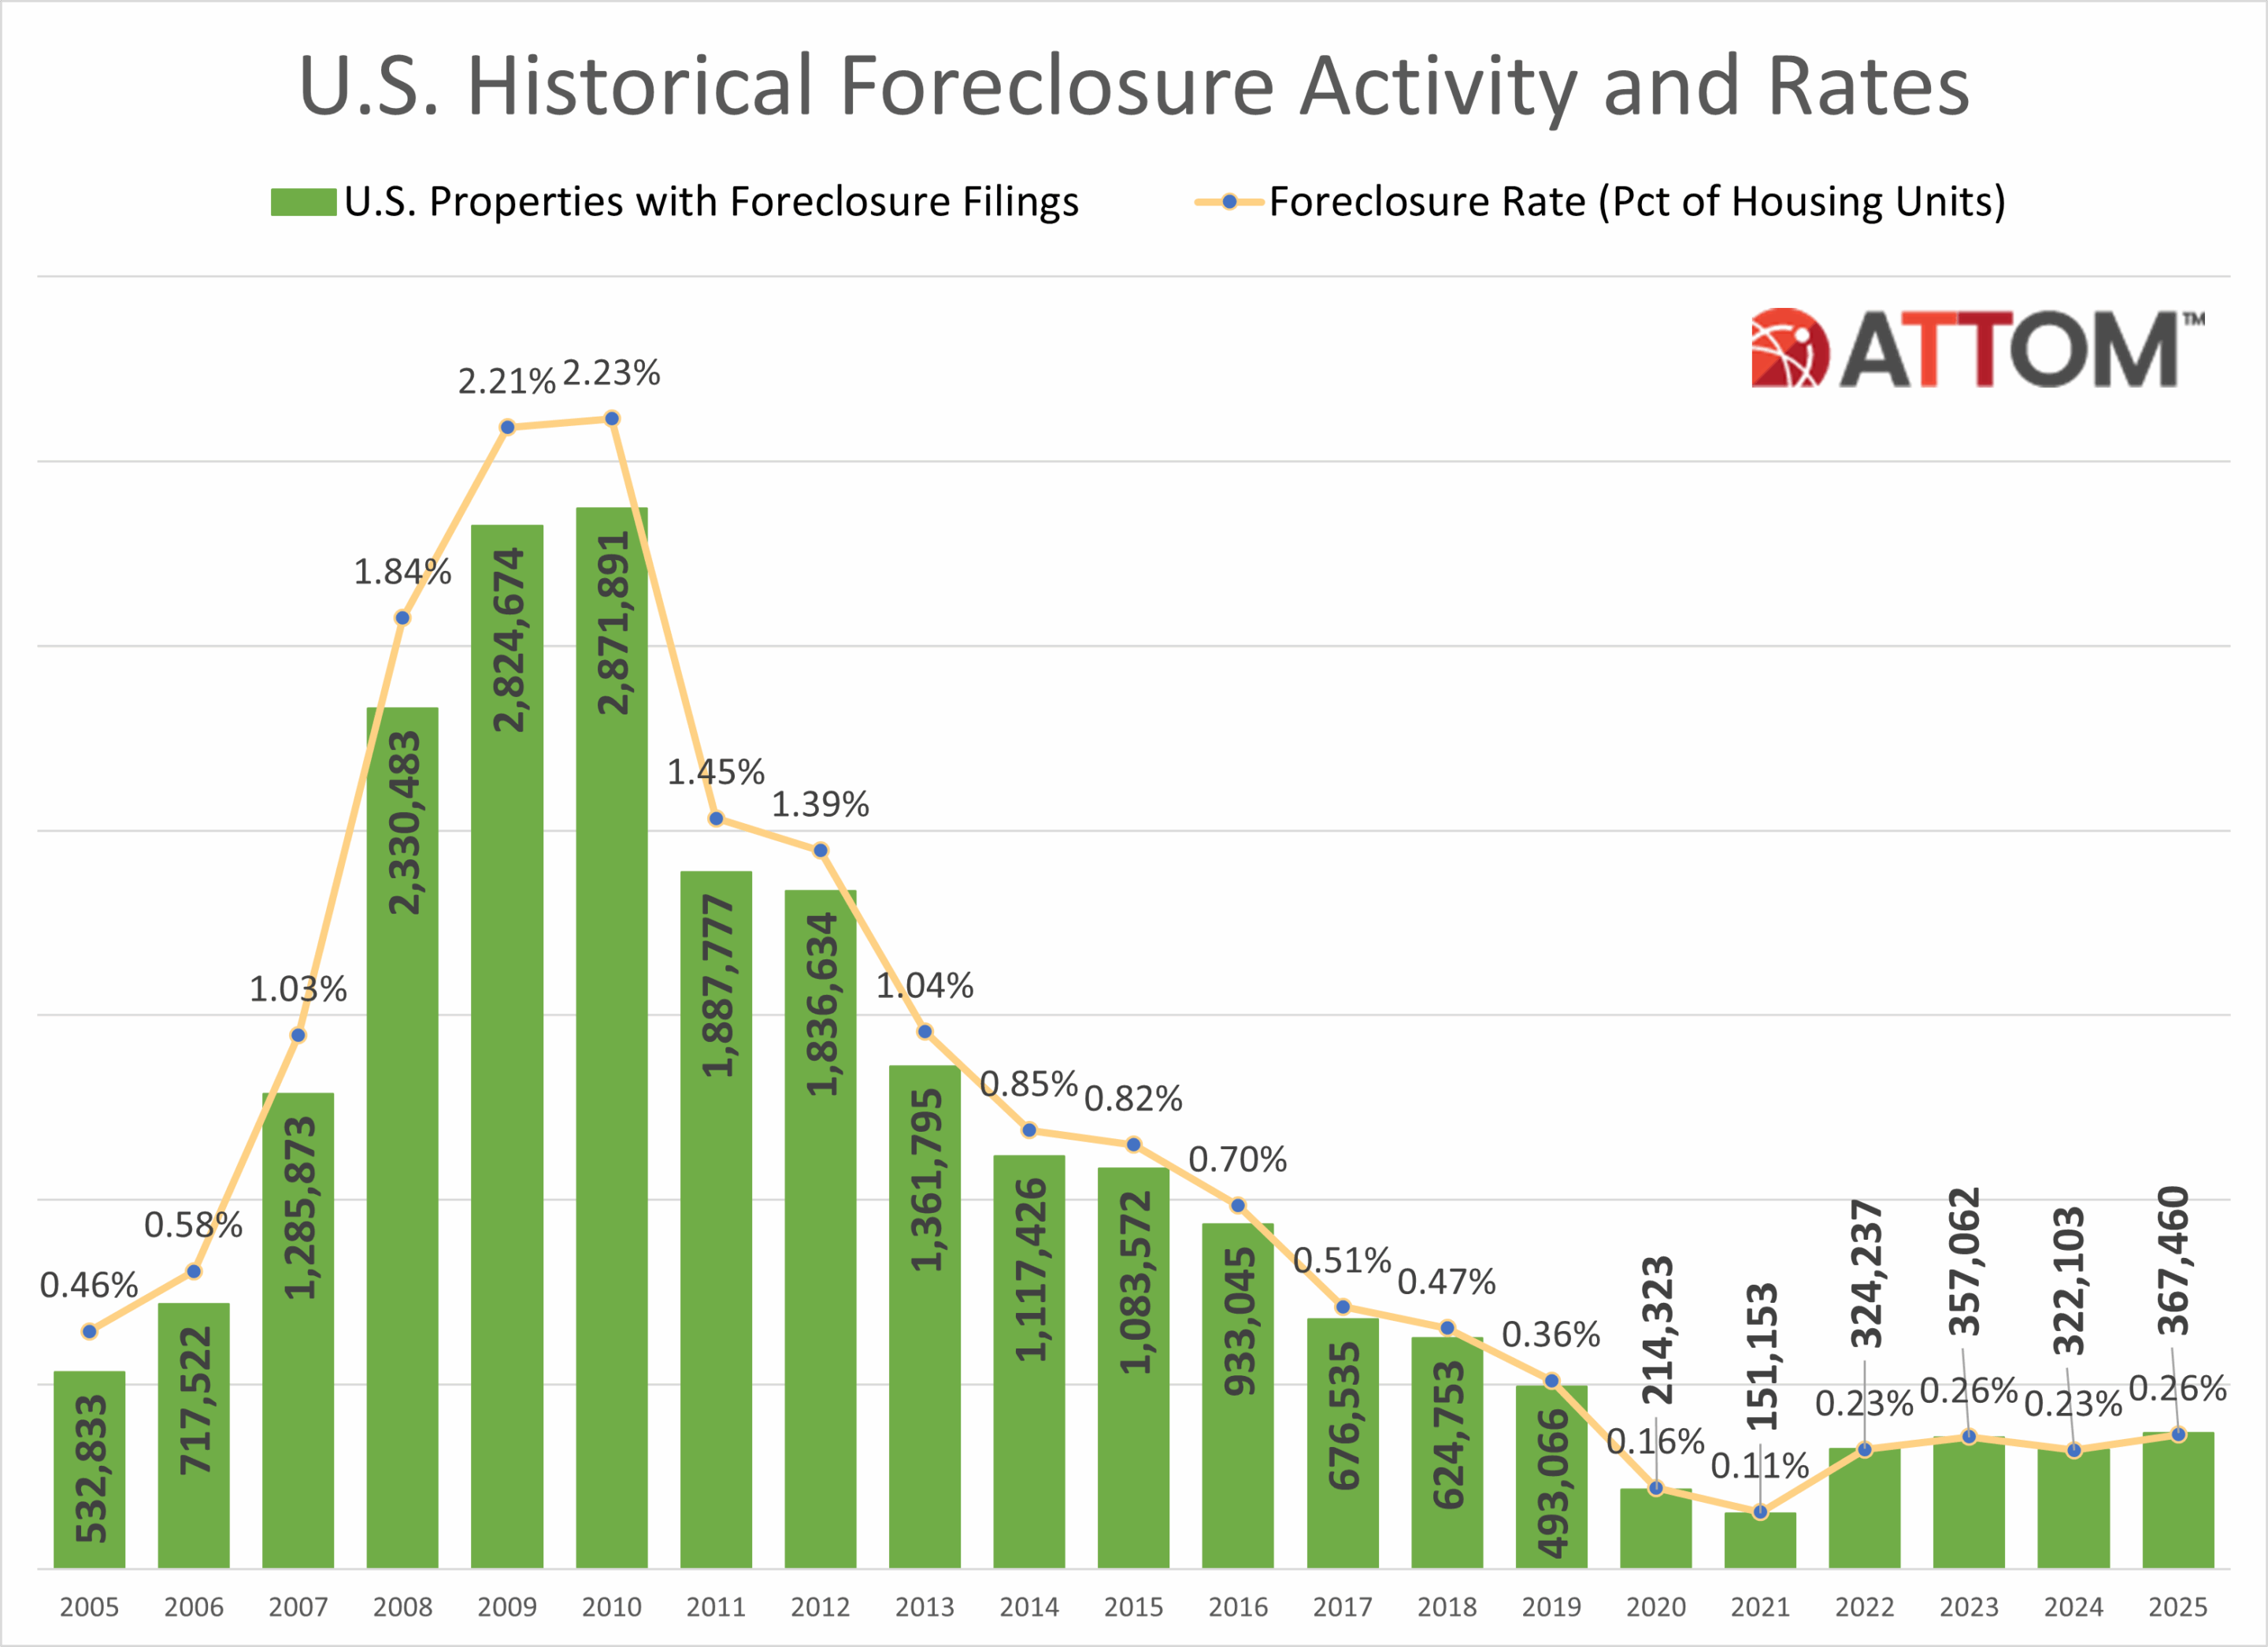
And finally, home foreclosures
-While foreclosures have grown above their historic lows during COVID, it's a very lagging indicator and is still well below any threshold for worry.
The bottom line on all of this is that our economic numbers have become a house of cards built so increasingly on not just deficit spending, that now deficit growth would need to increase even faster than it has just to keep us out of recession. Watch credit cards for growth in delinquencies and then charge-offs, then watch vehicle repo's and then watch bankruptcies as canaries of increasing importance in our economic coal mine.
quote:
1. Real GDP Per Person: $70,502
The same series put real GDP per capita at $68,979 in the first quarter of 2025
2. Real Consumption Per Person: $48,816
Real personal consumption expenditures per capita reached $48,816 in the first quarter of 2026, federal data shows, up from $47,881 a year earlier.
3. Real After-Tax Income Per Person: $52,330
Real disposable personal income per capita stood at $52,330 in April 2026, per the federal data, down from $52,934 in January but still above nearly every monthly reading in 2024.
4. Unemployment: 4.3 Percent
The unemployment rate was 4.3 percent in April 2026, the prime-age employment-population ratio was 80.7 percent, and total nonfarm payroll employment reached 158.736 million, the BLS data says.
All of those are happening due to the continued insane levels of deficit spending by Congress. Here's a fun chart to really see what I'm talking about, it shows year, YoY GDP growth (dollar amount) and the amount of federal deficit (ie: money dumped into the economy by adding to the debt):
2008...--..-...79...--...--..459
2009...---...292...---...1,413
2010...---...571...---...1,294
2011...---...551...---...1,300
2012...---...654...---...1,077
2013...---...627...--...-...680
2014...---...727...--...-...485
2015...---...687...--..--...442
2016...---...510...--...-...585
2017...---...807...-...--...665
2018...-..1,045...--...-...779
2019...---...883...--...-...984
2020...---...186...---...3,132
2021...--..2,327...---..2,775
2022...-...2,326...--...1,376
2023...--..1,714...--...1,695
2024...-...2,109...---..1,830
2025...-...1,590...--...1,780
You can look at that as the marginal utility of deficit dollars (my rudimentary version of ICOR).
For the years not bolded, that means we printed more money than the economy grew by (meaning utility ratio of less than 1:1) and 2022 was a bit of a cheat because a lot of that GDP growth was carryover from the extreme COVID deficits and various consumer debt forbearances. From 1970-2007 there was only one year where that happened. When you are in a fiat currency and your GDP growth cannot keep up with your debt-creation, you get inflation. When the glut of that money is going to the citizenry through NGOs and government programs (everything from Medicare to Section 8), that means that the economy is surviving only on government redistribution of wealth, not through organic growth of industry. Social programs make up ~60% of total spending with funding NGOs making up another ~3%-4%.
When I talk of economic doom and gloom, this is the foundational argument for that stance.
With that said, every one of your points -Every. Single. One.- is completely dependent on not just continued high deficit spending, but the growth of it. This means that if we cut spending, we strongly risk a recession. However, if we don't cut spending, we strongly risk continued inflation growth until inflation growth outpaces deficit spending enough that we go into a recession.
How is that not "doom"?
quote:
5. Household Debt Service: 11.32 Percent
Household and nonprofit net worth reached $184.1 trillion in the fourth quarter of 2025, Federal Reserve data shows, while household debt-service payments were 11.32 percent of disposable personal income.
That debt-service figure is higher than the post-pandemic lows, but it remains far below the 15 percent-plus burden seen before the 2008 financial crisis.
The problem is that this has been rising since 2022 and it gets worse when you consider that things like bankruptcy, vehicle repossessions, 180+ day delinquencies on credit cards, etc. all serve to lower Household Debt Service. So let's look at those in order of most immediate concern (credit card charge-offs, vehicle repo's, bankruptcies and then home foreclosures).
Credit Cards and other loans
Credit card charge-offs hit historic lows during COVID, so naturally they are going to increase. The problem is they've increased to not only pre-COVID levels but levels we haven't seen since coming down from the GFC-era spike. This is also true in the more general category of all consumer debt.
Vehicle repossessions (spreadsheet from Cox Automotive)
-Since the low of 2021, we've seen not only the amount of repo's grow every year, but a consistent growth in the default rate as well.
Bankruptcy filings
-While still near the historic lows of COVID, they have been consistently growing since 2022 and nearing pre-COVID levels. Since 2022 the increases have been double-digit percentages year-over-year (this is the total number, combining personal and business).
And finally, home foreclosures
-While foreclosures have grown above their historic lows during COVID, it's a very lagging indicator and is still well below any threshold for worry.
The bottom line on all of this is that our economic numbers have become a house of cards built so increasingly on not just deficit spending, that now deficit growth would need to increase even faster than it has just to keep us out of recession. Watch credit cards for growth in delinquencies and then charge-offs, then watch vehicle repo's and then watch bankruptcies as canaries of increasing importance in our economic coal mine.
This post was edited on 5/31/26 at 5:53 pm

Posted on 5/31/26 at 4:50 pm to Jbird
now do Debt to GDP ….
Posted on 5/31/26 at 4:53 pm to FLTech
quote:
Trump could balance the budget
No, he couldn't.
Not the way he likes to spend he couldn't.
Posted on 5/31/26 at 5:39 pm to wackatimesthree
quote:quote:No, he couldn't.
Trump could balance the budget
Not without causing a recession.
Posted on 5/31/26 at 5:43 pm to Bard
quote:
The bottom line on all of this is that our economic numbers have become a house of cards built so increasingly on not just deficit spending, that now deficit growth would need to increase even faster than it has just to keep us out of recession
Yea this is why I chuckle at articles that either champion the America economy vis a vis Europe or lament the anemic European economy compared to the American rocket.
It’s debt spending. Europe would boom too if it started running $2 trillion a year of deficit spending “stimulus”
Posted on 5/31/26 at 5:51 pm to ned nederlander
quote:
Europe would boom too if it started running $2 trillion a year of deficit spending “stimulus”
Economically, if the US sneezes, the world catches a cold. When our economic house of cards falls, the rest of the world is going to be in the shitter too. The only questions will be are they better able to weather the storm and if so, then why (and can we duplicate it).
Posted on 5/31/26 at 9:48 pm to Pondyrosa
I don't really care. Deal with it

 Page 2 of 2


Popular
Back to top