- My Forums
- Tiger Rant
- LSU Recruiting
- SEC Rant
- Saints Talk
- Pelicans Talk
- More Sports Board
- Fantasy Sports
- Golf Board
- Soccer Board
- O-T Lounge
- Tech Board
- Home/Garden Board
- Outdoor Board
- Health/Fitness Board
- Movie/TV Board
- Book Board
- Music Board
- Political Talk
- Money Talk
- Fark Board
- Gaming Board
- Travel Board
- Food/Drink Board
- Ticket Exchange
- TD Help Board
Customize My Forums- View All Forums
- Show Left Links
- Topic Sort Options
- Trending Topics
- Recent Topics
- Active Topics
Started By
Message

The Stunning Statistical Fraud Behind The Global Warming Scare
Posted on 2/11/19 at 5:38 pm

Posted on 2/11/19 at 5:38 pm
quote:
Global Warming: The National Oceanic and Atmospheric Administration may have a boring name, but it has a very important job: It measures U.S. temperatures. Unfortunately, it seems to be a captive of the global warming religion. Its data are fraudulent.
What do we mean by fraudulent? How about this: NOAA has made repeated "adjustments" to its data, for the presumed scientific reason of making the data sets more accurate.
Nothing wrong with that. Except, all their changes point to one thing — lowering previously measured temperatures to show cooler weather in the past, and raising more recent temperatures to show warming in the recent present.
This creates a data illusion of ever-rising temperatures to match the increase in CO2 in the Earth's atmosphere since the mid-1800s, which global warming advocates say is a cause-and-effect relationship The more CO2, the more warming.
But the actual measured temperature record shows something different: There have been hot years and hot decades since the turn of the last century, and colder years and colder decades. But the overall measured temperature shows no clear trend over the last century, at least not one that suggests runaway warming.
That is, until the NOAA's statisticians "adjust" the data. Using complex statistical models, they change the data to reflect not reality, but their underlying theories of global warming. That's clear from a simple fact of statistics: Data generate random errors, which cancel out over time. So by averaging data, the errors mostly disappear.
That's not what NOAA does.
Investors Business Daily
 11
11


Posted on 2/11/19 at 5:40 pm to L.A.
It is the biggest fraud ever committed on mankind
Posted on 2/11/19 at 5:43 pm to RockyMtnTigerWDE
But 97% of scientists, yo

Posted on 2/11/19 at 5:47 pm to L.A.
Here's some more fun; The underlying math used in the models to project future warming is based on the Earth being flat. The real science deniers
I read a criticism of this that mentioned that they "averaged" different parts of the globe in their equations, but that doesn't mean shite since the Earth heats and cools differently at different places all the time. It still assumes the Earth is flat.
Oh, and BTW, when have higher co2 levels ever been bad for life on Earth?
This post was edited on 2/11/19 at 5:56 pm

Posted on 2/11/19 at 5:56 pm to L.A.
quote:
This creates a Data Illusion
Exactly
Posted on 2/11/19 at 6:01 pm to L.A.
quote:
That is, until the NOAA's statisticians "adjust" the data. Using complex statistical models, they change the data to reflect not reality, but their underlying theories of global warming
Evolutionists did that too.
Not saying evolution isn't true but the advocates in so-called academia created fakes, committed fraud - all in an attempt to convince the public overnight...instead of taking time to see how the theory plays out with normal excavations and studies.
American science is rife with dogma once something becomes Gospel...there's no dissent. Same cloth of the MSM.
Posted on 2/11/19 at 6:08 pm to L.A.
quote:I had always thought that this was sketchy, until I downloaded the methodology guide and unless their changes did not follow their own methodology, the adjustments to appear justified.
What do we mean by fraudulent? How about this: NOAA has made repeated "adjustments" to its data, for the presumed scientific reason of making the data sets more accurate.
Nothing wrong with that. Except, all their changes point to one thing — lowering previously measured temperatures to show cooler weather in the past, and raising more recent temperatures to show warming in the recent present.
Now since measurement and model error have a range, and the adjustments could have a range of reasonable possibilities to apply, I do wonder if they err on the side of the range that aligns with their biases. So instead of fraudulent data, we get data that is still technically empirically defensible, but ends up with biased estimates and projections.

Posted on 2/11/19 at 6:21 pm to RockyMtnTigerWDE
quote:
It is the biggest fraud ever committed on mankind
2nd biggest - Communist/Socialist Utopia takes first credits

Posted on 2/11/19 at 6:36 pm to mizzoubuckeyeiowa
I'm a Scientist and I'll say it. They are both fraudulent hoaxes created by the Left.
Posted on 2/11/19 at 6:51 pm to L.A.
quote:
But 97% of scientists, yo
99% of whom make money off global warming
Hypothetical:
Guy spends 10 years getting a doctorate, focusing on climate science.
Does he get more grant money if climate change is a "crisis"?

Posted on 2/11/19 at 6:52 pm to mizzoubuckeyeiowa
quote:
Evolutionists did that too.
Wow, I'm glad we didn't have to pay for any of Lucy's outfits.

Posted on 2/11/19 at 6:53 pm to L.A.
Just tax the problem so it can go away.
Posted on 2/11/19 at 7:43 pm to L.A.
Explaination of how and why there are temperature adjustments
And before the source is questioned (despite the OP coming with IBD in a piece quoting a breitbart writer, a climate skeptic blog, and a random blogger on wordpress), here's a piece about how there's no causation found for a warmer arctic leading to more cold outbreaks: LINK
So it's not just ALARM for every weather event.
Now to quote the important parts of my initial article:
The conclusion?
Here's a chart of adjusted records, performed by numerous different groups:
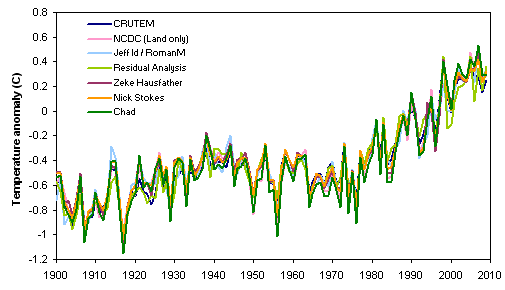
You might notice the upward trend in all the data since 1970. The UKMet office has shown similar behavior to all the data sets we have.
It's not some grand hoax by NOAA. If it were, you'd think every oil company on earth would have proved it was by now.
And before the source is questioned (despite the OP coming with IBD in a piece quoting a breitbart writer, a climate skeptic blog, and a random blogger on wordpress), here's a piece about how there's no causation found for a warmer arctic leading to more cold outbreaks: LINK
So it's not just ALARM for every weather event.
Now to quote the important parts of my initial article:
quote:
The adjustments that have a big impact on the surface temperature record all occur before 1950. Here, past temperatures are adjusted up – significantly reducing the warming over the past century. Over the full 1880-2016 period, the adjusted data actually warms more than 20% slower than the raw data. The large adjustments before 1950 are due almost entirely to changes in the way ships measured temperatures.
quote:
A single weather station will likely see many changes over the decades that it is in use. Few stations remain in exactly the same place over very long periods, with most stations experiencing at least one move to a new location. Most stations have also changed the way they measure temperatures, transitioning from liquid-in-glass thermometers to electronic instruments. Stations have often changed the time of day they measure temperatures, and growing cities and urban areas can introduce artificial warming in some stations. Very local factors, such as trees growing over stations or poor station siting, can also cause problems.
To correct for differences in a temperature record caused by these changes, known as inhomogeneities, scientists employ an approach known as statistical homogenization. They compare each station to all of its nearby neighbours and look for changes that are local to one station, but not found at any others in the area. Over long periods of time, climate changes are very rarely local, so localised changes not seen at surrounding stations are most likely due to something such as a station move or instrument change.
For example, if one station is warming over the course of a decade, while all the surrounding stations are cooling, that station would be flagged as “inhomogenous” and its record would be corrected to bring it back in line with its neighbours.
quote:
Since 1990, the way that oceans temperatures are measured has changed once again. While about 90% of measurements came from ships 20 years ago, today almost 80% come from buoys floating in the ocean. These buoys are in direct contact with the water and end up reading temperatures slightly lower than measurements taken in engine room intakes. To correct for a cool bias introduced by adding cooler buoy data to warmer ship data, temperatures are adjusted slightly upwards for recent years. This fact proved quite controversial with the publication of a paper by Tom Karl and colleagues in 2015, but has since been validated by other studies. The net effect of these buoy-related adjustments, however, is relatively small.
The conclusion?
quote:
With almost 200 years of raw data to work with, adjustments are a necessary part of the methodology for scientists constructing long-term global temperature records. But most of these adjustments are small and they have relatively little impact on temperature records over the past few decades.
The most significant account for the shift from buckets to ship intakes in ocean temperature records in the 1930s and 1940s, and these changes are well-understood by scientists. And, contrary to popular belief, adjustments actually reduce, rather than increase, the amount of warming experienced globally over the past century.
Here's a chart of adjusted records, performed by numerous different groups:
You might notice the upward trend in all the data since 1970. The UKMet office has shown similar behavior to all the data sets we have.
It's not some grand hoax by NOAA. If it were, you'd think every oil company on earth would have proved it was by now.
Posted on 2/11/19 at 7:59 pm to Duke
quote:The “hoax” argument has become extremely frustrating because it’s drowned out all of the many valid criticisms of the science and its limitations.
It's not some grand hoax by NOAA. If it were, you'd think every oil company on earth would have proved it was by now.
So instead of countering the doomsday hyperbole that goes well beyond the scientific evidence and beyond any reasonable extrapolation of it, with reasonable and evidence-based arguments pointing out the flaws in that hyperbole, the counter argument is just as extreme and somehow even further from the empirical evidence. And worse they allow the doomsayers to use these absurdities as the salient and pervasive examples of the other side, even those with reasonable and valid arguments.
Posted on 2/11/19 at 8:12 pm to Duke
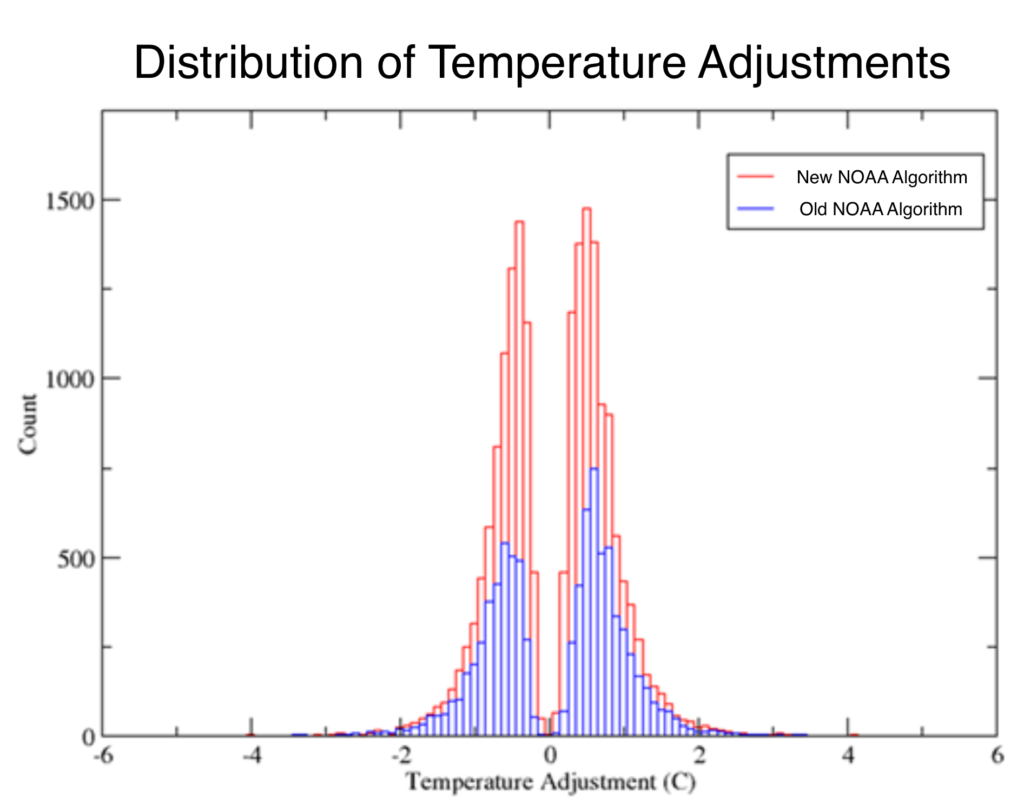
You realize that distribution of temperature adjustments gives absolutely no actual data that's helpful. If someone wants to put together a chat of the adjustments correlated to the year the data point is from and how much they changed it and in what direction, that would be helpful. That chart looks great but it just means roughly half the changes were up and half were down. How are those spread out? If the points the lowered were early in the century and the points the raised were in later years, you are doubling your trend
Posted on 2/11/19 at 8:23 pm to narddogg81
quote:
If the points the lowered were early in the century and the points the raised were in later years, you are doubling your trend
Yes, but that isn't what is happening. I quoted bits to show where adjustments are made. I'll grant you without source data, it's not proof of much. So I'll link you to the NOAA report it was contained in and an anecdote from my article to give you some additional background.
quote:
Here, roughly half of all corrections reduce the temperature and half increase it. For example, one station in Darwin, Australia has been adjusted to show more warming to account for a station move and shelter change in the 1940s. Yet the adjustment of another station – this time a station in Tokyo, Japan – has reduced the warming it shows to correct for the urban heat island effect of an expanding city.
ftp://ftp.ncdc.noaa.gov/pub/data/ghcn/v3/techreports/Technical%20Report%20NCDC%20No12-02-3.2.0-29Aug12.pdf
^just copy and paste it
This post was edited on 2/11/19 at 8:25 pm
Posted on 2/11/19 at 8:28 pm to narddogg81
quote:That’s not true. As I noted above, we can quantify measurement and model errors and the margin around that error. So if the adjustments are within the quantified range and distraction, that is helpful, even if it doesn’t give a complete picture.
You realize that distribution of temperature adjustments gives absolutely no actual data that's helpful. I
quote:Well even if that’s true, that in and of itself doesn’t tell use whether those changes are valid and justifiable or not. What is important is if the error and empirical evidence supports the adjustments. If the evidence suggests early instruments and their measurement had an upward bias, then it’s justifable to adjust them downward.
If the points the lowered were early in the century and the points the raised were in later years, you are doubling your trend
Like I said earlier, I had always been skeptical of those adjustments, but when I read one of the methodology guides, I found their rationale to be valid and evidence-based. That doesn’t mean their own biases didn’t have some impact within the range of possibilities, but the idea that it’s a hoax and the models are fraud, is not evidenced in a broad look at the adjustments themselves.
In order to support the fraud argument, someone would have to actually independently analyze the data and determine that they either didn’t follow their methodology and/or their methodology was not supported by the evidence.
Posted on 2/11/19 at 8:30 pm to Duke
quote:that's great. One anecdote of warming one station in the 40s doesnt do much for me. I want to see all that data plotted. I'm inclined to think that if plotting it out in that way would strengthen the case against objections you would see that graph everywhere. I know I've seen the raw data plotted out many times making a sine wave for the 20th century
Yes, but that isn't what is happening. I quoted bits to show where adjustments are made. I'll grant you without source data, it's not proof of much. So I'll link you to the NOAA report it was contained in and an anecdote from my article to give you some additional background.
This post was edited on 2/11/19 at 8:31 pm
Posted on 2/11/19 at 8:37 pm to narddogg81
quote:There are many reputable scientists who have made valid criticisms of the current theory.
I want to see all that data plotted. I'm inclined to think that if plotting it out in that way would strengthen the case against objections you would see that graph everywhere.
Yet, I can’t think of one who has argued that the data itself is fraudulent. They mostly criticize things like causation and predictions, which are far either far harder to support (e.g., causation is arguably the hardest thing to establish in science) or some we’re just terrible at establishing (e.g., we are terrible at predictions).
Fraudulent data would be much easier to identify, and would be far easier to “prove.” So I think the fact that the extremely capable critics haven’t made this claim probably means it’s not a valid claim.
This post was edited on 2/11/19 at 8:39 pm
Posted on 2/11/19 at 8:39 pm to buckeye_vol
quote:every temperature point adjustment made needs to subject to an independent audit, with citation of what is adjusted, and why. We are talking about data that people are using to justify economic decisions that cost trillions of dollars.
In order to support the fraud argument, someone would have to actually independently analyze the data and determine that they either didn’t follow their methodology and/or their methodology was not supported by the evidence.

 Page 1 of 2

Popular
Back to top