- My Forums
- Tiger Rant
- LSU Recruiting
- SEC Rant
- Saints Talk
- Pelicans Talk
- More Sports Board
- Fantasy Sports
- Golf Board
- Soccer Board
- O-T Lounge
- Tech Board
- Home/Garden Board
- Outdoor Board
- Health/Fitness Board
- Movie/TV Board
- Book Board
- Music Board
- Political Talk
- Money Talk
- Fark Board
- Gaming Board
- Travel Board
- Food/Drink Board
- Ticket Exchange
- TD Help Board
Customize My Forums- View All Forums
- Show Left Links
- Topic Sort Options
- Trending Topics
- Recent Topics
- Active Topics
Started By
Message
re: Daily COVID Updated as of 11/2/20 8:00 PM
Posted on 7/1/20 at 5:41 pm to Chromdome35
Posted on 7/1/20 at 5:41 pm to Chromdome35
This is the link to the COVID-19 tracker that I have created and shared on Google Drive.
If you want to view the shared sheet, follow this link COVID-19 Tracker
If you want to download a copy of this sheet and manipulate it follow this link Downloadable COVID-19 Tracker
The source for the data is from https://covidtracking.com/data/
NOTE: For Wednesday 7/1 California did not submit numbers in time to make it into the tracking ecosystem. This caused Wednesday to be understated by almost 10K cases. The numbers have now been corrected.


New Cases by State

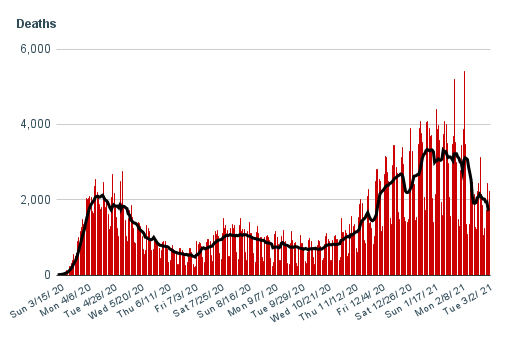
New Deaths by State

7-day average growth rate of new cases

If you want to view the shared sheet, follow this link COVID-19 Tracker
If you want to download a copy of this sheet and manipulate it follow this link Downloadable COVID-19 Tracker
The source for the data is from https://covidtracking.com/data/
NOTE: For Wednesday 7/1 California did not submit numbers in time to make it into the tracking ecosystem. This caused Wednesday to be understated by almost 10K cases. The numbers have now been corrected.
New Cases by State
New Deaths by State
7-day average growth rate of new cases
This post was edited on 7/2/20 at 9:29 am
 4
4

Posted on 7/1/20 at 7:41 pm to Chromdome35
Can we also add a hospital bed tracker? Seems like they are nearing capacity in Houston, Yakima and maybe a county or two in California.

Posted on 7/1/20 at 8:26 pm to Chromdome35
First time we've had no numbers in the 700s in the 7 day average. Looks like we will hit below 500 - 7 day average tomorrow. Think that is a milestone worth noting.
Posted on 7/2/20 at 8:40 am to Chromdome35
California didn't report data in time to get into the tracking ecosystem yesterday. Evidently they had enough new cases to put the US daily total over 50K for the first time.
UPDATE: 7/2 9:23AM COVID Tracking Project has updated their numbers for yesterday to include California. I have updated my tracker to match.
UPDATE: 7/2 9:23AM COVID Tracking Project has updated their numbers for yesterday to include California. I have updated my tracker to match.
This post was edited on 7/2/20 at 9:23 am
Posted on 7/2/20 at 12:10 pm to Chromdome35
Interesting comment:
LINK
quote:
OK, so people are concerned deaths are not tracking confirmed cases. There are two big reasons. First, deaths lags cases by 27 days now, and only lagged by 7-8 days in March. So, when people try to line them up, they line up the exponential rise in March. What has changed is people are testing closer to inoculation, and it takes less time from taking the test to reporting it. Second, test positivity is much lower, so we are missing fewer cases now than we did in early April. If you use the 27 day lag, and line up deaths with infection density, it is much harder to convince yourself there has been any change in the infectivity and danger of COVID-19. Instead, the additional time lag has given people a sense of false comfort that will come crashing down, in another 2-3 weeks, in Arizona. Here are plots of deaths overlaid with confirmed cases, nationally, and with infection density, to illustrate the sense of false comfort (top), and something closer to reality (bottom). We have the data to fine tune the infection density estimations again, and I think the sqrt rule will change to something like a 0.4 exponent rule, but I need time to analyze it properly.
LINK

 Page 1 of 1


Popular
Back to top