- My Forums
- Tiger Rant
- LSU Recruiting
- SEC Rant
- Saints Talk
- Pelicans Talk
- More Sports Board
- Fantasy Sports
- Golf Board
- Soccer Board
- O-T Lounge
- Tech Board
- Home/Garden Board
- Outdoor Board
- Health/Fitness Board
- Movie/TV Board
- Book Board
- Music Board
- Political Talk
- Money Talk
- Fark Board
- Gaming Board
- Travel Board
- Food/Drink Board
- Ticket Exchange
- TD Help Board
Customize My Forums- View All Forums
- Show Left Links
- Topic Sort Options
- Trending Topics
- Recent Topics
- Active Topics
Started By
Message

 2
2

Posted on 10/6/22 at 1:36 pm to GumboPot
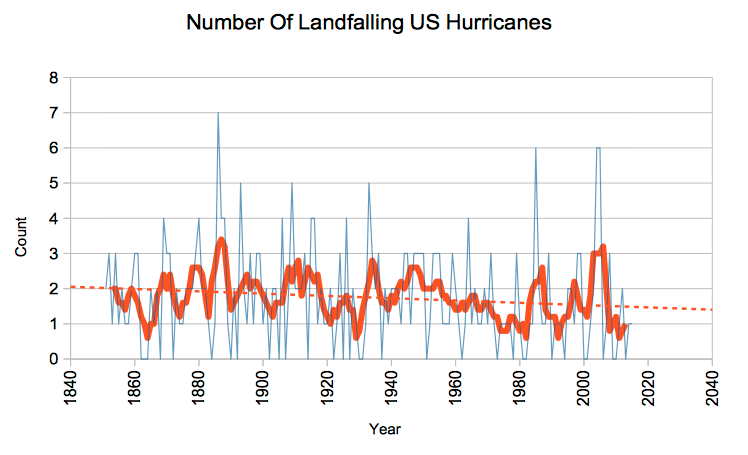
Gumbopot's graph showing the number of hurricanes, looks to follow a pattern. In almost each 20 yr chunk you have a valley and spike. Doesn't the sun go thru solar cycles with higher solar storms every 10 or 11 yrs?
Maybe there is correlation with hurricane severity, solar storms and higher temps. Just thinking out load.
Maybe there is correlation with hurricane severity, solar storms and higher temps. Just thinking out load.

Posted on 10/6/22 at 1:39 pm to GumboPot
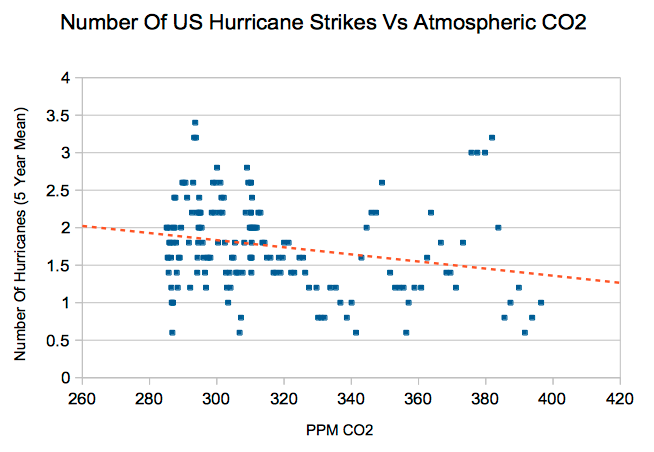
Looks like we need to kick up the C02 based in that second figure

 Page 1 of 1


Popular
Back to top