- My Forums
- Tiger Rant
- LSU Recruiting
- SEC Rant
- Saints Talk
- Pelicans Talk
- More Sports Board
- Fantasy Sports
- Golf Board
- Soccer Board
- O-T Lounge
- Tech Board
- Home/Garden Board
- Outdoor Board
- Health/Fitness Board
- Movie/TV Board
- Book Board
- Music Board
- Political Talk
- Money Talk
- Fark Board
- Gaming Board
- Travel Board
- Food/Drink Board
- Ticket Exchange
- TD Help Board
Customize My Forums- View All Forums
- Show Left Links
- Topic Sort Options
- Trending Topics
- Recent Topics
- Active Topics
Started By
Message
re: Daily COVID Updated as of 11/2/20 8:00 PM
Posted on 10/25/20 at 6:34 pm to Chromdome35
Posted on 10/25/20 at 6:34 pm to Chromdome35
This is the link to the COVID-19 tracker that I have created and shared on Google Drive.
If you want to view the shared sheet, follow this link COVID-19 Tracker
If you want to download a copy of this sheet and manipulate it follow this link Downloadable COVID-19 Tracker
The source for the data is from https://covidtracking.com/data/


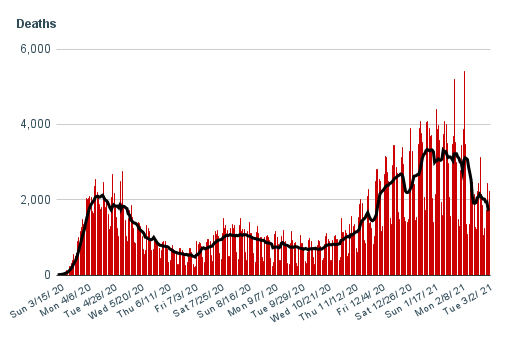


7 Day Average Growth of New Cases by State

7 Day Average Growth of Deaths by State

7-day average Positivity Rate

If you want to view the shared sheet, follow this link COVID-19 Tracker
If you want to download a copy of this sheet and manipulate it follow this link Downloadable COVID-19 Tracker
The source for the data is from https://covidtracking.com/data/
7 Day Average Growth of New Cases by State
7 Day Average Growth of Deaths by State
7-day average Positivity Rate
 2
2

Posted on 10/25/20 at 9:37 pm to Chromdome35
Those PCP test are faulty . Too sensitive. No accident. Yeah people are still getting it ....just not in droves it's portrayed now.
Posted on 10/26/20 at 11:09 am to Chromdome35
The growth rate of new cases is being driven by the increase in the positivity rate.
In this graph you can see how testing is on a steady upward trend, the case line is growing at a much steeper rate. If the positive rate was constant and not growing (as it is) then the case line would mirror the slope of the testing line.
This shows the positivity rate, you can see the clear increase.
When you overlay the cases line with the positivity rate, you see they are fairly well matched

 Page 1 of 1


Popular
Back to top