- My Forums
- Tiger Rant
- LSU Recruiting
- SEC Rant
- Saints Talk
- Pelicans Talk
- More Sports Board
- Fantasy Sports
- Golf Board
- Soccer Board
- O-T Lounge
- Tech Board
- Home/Garden Board
- Outdoor Board
- Health/Fitness Board
- Movie/TV Board
- Book Board
- Music Board
- Political Talk
- Money Talk
- Fark Board
- Gaming Board
- Travel Board
- Food/Drink Board
- Ticket Exchange
- TD Help Board
Customize My Forums- View All Forums
- Show Left Links
- Topic Sort Options
- Trending Topics
- Recent Topics
- Active Topics
Started By
Message
re: Daily COVID Updated as of 11/2/20 8:00 PM
Posted on 3/25/20 at 3:02 pm to Chromdome35
Posted on 3/25/20 at 3:02 pm to Chromdome35
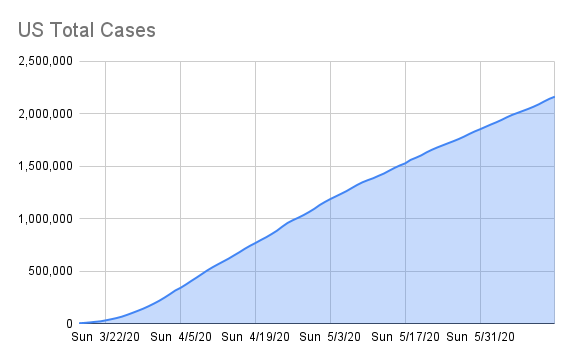
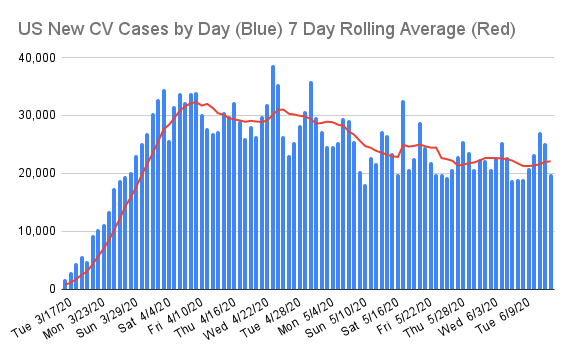
This is the link to the COVID-19 tracker that I have shared on Google Drive. Chromdome's COVID-19 Daily Tracker
The source for the data is https://www.worldometers.info/coronavirus/
The source for the testing data is from https://covidtracking.com/data/
On the tracker sheet you will see tabs for the following data:
1) US Summary
2) Country Comparables: This shows you how the US stacks up vs. select other countries dealing with COVID-19
3) Italy Summary
4) UK Summary
5) France Summary
6) Germany Summary
New Tabs added in the last day
7) US Weighted Averages - Explores 7 day vs 3 day weight average trends
8) Predictive Model - A simple predictive model that shows where the numbers will be in the future if growth rates don't change
If you would like a graph created that I don't have, just ask and if it's possible I will create it for you.
Due to space constraints on the PT board, I'm only posting a few graphs in the thread, if a consensus emerges of what graphs the PT wants to see in thread without having to go to the tracker, I will gladly change them up.
I am working to create a sheet that compares the US metrics to the other countries metrics. I'll let you all know when that's done and available.
NOTE: The daily growth rate data will not be accurate until the end of the day's postings. It will change throughout the day.
NOTE: I am not tracking individual states, I don't have a reliable consistent source for that data.
NOTE: I am not a mathematician, statistics guru, scientist, sharpest tack in the box, I'm just a guy who likes to understand for myself what is happening and to share it with others. This thread was not created to debate if you should or shouldn't take this seriously, it is simply to present the numbers and foster conversation.

This post was edited on 3/25/20 at 3:07 pm
Posted on 3/25/20 at 3:10 pm to Chromdome35
Posted on 3/25/20 at 3:27 pm to Chromdome35
Some notable negative movement for the US in terms of deaths per million. Started the day even with Germany and South Korea and have since jumped China, Norway, and Austria. Still nowhere near the worst EU countries (we're at 3 deaths per million and Italy and Spain are at 124 and 74, respectively) but don't like to see that relative to our peers.
Posted on 3/25/20 at 9:04 pm to Chromdome35
quote:
Chromdome35
Thanks for all the constant updated info, Chromdome35. Far more data than I know what to do with, and I am a big data/stats guy, so I eat it up.
The only question I have, is with Microsoft Word, for large tables there is a feature that allows you to anchor the headers of data columns, so once those tables gets large (long with hundreds of rows of data), once anchored you can scroll down the rows of data, and the headers don't scroll up and out of view, but stay there at the top, and it's the rows that scroll up out of view underneath the headers.
Don't know if that function exists for the Google software, but it's helpful as one scrolls down the long list, to still have the headers displayed to help with remembering what each column of data represents.
If it's available and easy to edit, you may wish to consider that as the table of daily updates keep getting longer. If it's not available or too difficult to manage, then don't worry about it. We can manage as it is. Thanks again!
Popular
Back to top
 3
3


