- My Forums
- Tiger Rant
- LSU Recruiting
- SEC Rant
- Saints Talk
- Pelicans Talk
- More Sports Board
- Fantasy Sports
- Golf Board
- Soccer Board
- O-T Lounge
- Tech Board
- Home/Garden Board
- Outdoor Board
- Health/Fitness Board
- Movie/TV Board
- Book Board
- Music Board
- Political Talk
- Money Talk
- Fark Board
- Gaming Board
- Travel Board
- Food/Drink Board
- Ticket Exchange
- TD Help Board
Customize My Forums- View All Forums
- Show Left Links
- Topic Sort Options
- Trending Topics
- Recent Topics
- Active Topics
Started By
Message
re: Just a reminder about the relationship between CO2 and the earth's temperature
Posted on 6/20/22 at 8:01 pm to Ramblin Wreck
Posted on 6/20/22 at 8:01 pm to Ramblin Wreck
Has anyone proposed higher taxes? That should cool the planet.
 2
2

Posted on 6/20/22 at 8:50 pm to biglego
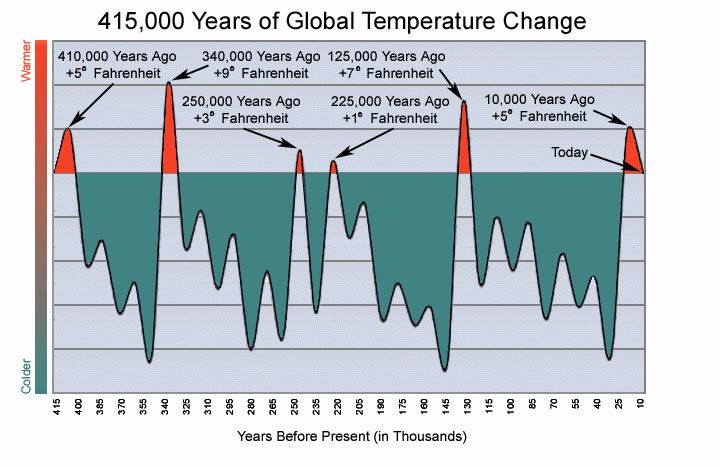
I like this older report but especially the graph. It shows the earth is its own decider and has some trends over time. Yet warmers only see less than 10 years and declare end of days. The next phase will be ice age again but long after we’re all 6 feet under.

Vostok Ice Cores and the 8,000-year Lag
During Earth’s recent history, there has been a relationship between carbon dioxide and global temperatures: when temperatures rise, the concentration of CO2 subsequently rises, and when temperatures fall, CO2 concentration thereafter declines. Ice cores from Vostok in Antarctica have been studied intensively to analyze temperatures and concentrations of various gases over the course of millennia. Euan Mearns reviews the literature as it relates to both CO2 and methane:
In their seminal paper on the Vostok Ice Core, Petit et al (1999) note that CO2 lags temperature during the onset of glaciations by several thousand years but offer no explanation. They also observe that CH4 and CO2 are not perfectly aligned with each other but offer no explanation. The significance of these observations [is] therefore ignored. At the onset of glaciations temperature drops to glacial values before CO2 begins to fall suggesting that CO2 has little influence on temperature modulation at these times. …
The fit of CO2 to temperature is actually not nearly so tight as for CH4. There is a persistent tendency for CO2 to lag temperature throughout and this time lag is most pronounced at the onset of each glacial cycle “where CO2 lags temperature by several thousand years.”
This chart shows how the Vostok ice cores reveal temperature and CO2 concentration over the Earth’s recent history, i.e., the last 450,000 years. The present is on the left
—-
This chart might be easier to read than the one above but its based on same ice cores as above but the present time is on the right.
LINK
This post was edited on 6/20/22 at 8:59 pm
Posted on 6/21/22 at 2:24 pm to biglego
quote:
Has anyone proposed higher taxes? That should cool the planet.
Maurice Strong and Al Gore had an even more elaborate scheme than simple taxation.
The bad part for Gore is he made a film with dated predictions. To date, not one has come to fruition.
That's how you know they aren't using real science, merely snake oil salesmen.

 Page 1 of 1


Popular
Back to top