- My Forums
- Tiger Rant
- LSU Recruiting
- SEC Rant
- Saints Talk
- Pelicans Talk
- More Sports Board
- Fantasy Sports
- Golf Board
- Soccer Board
- O-T Lounge
- Tech Board
- Home/Garden Board
- Outdoor Board
- Health/Fitness Board
- Movie/TV Board
- Book Board
- Music Board
- Political Talk
- Money Talk
- Fark Board
- Gaming Board
- Travel Board
- Food/Drink Board
- Ticket Exchange
- TD Help Board
Customize My Forums- View All Forums
- Show Left Links
- Topic Sort Options
- Trending Topics
- Recent Topics
- Active Topics
Started By
Message
An Examination of The Golden and Death Crosses
Posted on 11/7/18 at 12:45 pm
Posted on 11/7/18 at 12:45 pm
If you watch or read financial news, you've likely heard about the Death Cross, the supposed ender of bull markets, destroyer of worlds, and puppy kicker. If you're not aware, the Death Cross is when the 50 day simple moving average crosses below the 200 day simple moving average. The opposite, when the 50 day crosses above the 200 day, is a Golden Cross and a positive sign for bull markets, imminent utopia, and pretzel day.
Honestly, though, they aren't that impressive. TL;DR: buy the dips, ignore the Death Cross boogeyman, bear markets are over once a Golden Cross appears.
I adjusted a strategy script to buy long every Golden Cross and sell short every Death Cross. Exits only happen at opposing crosses. For the interested readers with thinkorswim, here's a link to the thinkscript: LINK.
Here's an Imgur album of chart screenshots from September 1982 to date for SPX. The indicator below the chart shows net gains and losses in points. The chart actually goes all the way back to January 3, 1928 when SPX closed at 17.76, but I'm not going to do that many screenshots. Instead, here's a detailed spreadsheet of all orders; I closed the current long position at yesterday's closing price to get totals.
The strategy appears to have outperformed SPX by about 11%, or 300 points, over a 90 year period. But the strategy doesn't account for fees, taxes, and slippage on orders. Those factors could turn the system into an underperformer. On the other hand, the system doesn't compound; all positions are +1 or -1.
Shorting Death Crosses was only profitable 30% of the time and is only net profitable (excluding the aforementioned factors) because of the tech bubble and Great Recession. The Death Cross in 1987 would've lost money because the indicator lags behind price, and the bottom was established more than 2 weeks before that Death Cross. Death Crosses that are profitable to short are separated from each other by at least 1 unprofitable Death Cross. Skipping so would've netted 426.75 points; otherwise, shorting all Death Crosses made 160.63 points.
Buying Golden Crosses was profitable 67% of the time and would've netted 2,894.8 points. They're great to recognize when a bear market is over, but just buying the dip usually has better entries than buying Golden Crosses following non-bear markets. The last 50 years have had only 6 of the 15 unprofitable Golden Crosses; likewise, just 5 of the 14 profitable Death Crosses have happened in the last 50 years.
 1
1


Posted on 11/11/18 at 5:36 pm to Omada
Have an upvote, sir.
This is remarkable.
I disagree strongly with your general conclusion, but I'm impressed that you have something showing an advantage. The geometric mean is the key result people look for, but seeing the variance on your 90-year study would be really interesting too (since the primary driver behind most 50d-200d strategies is to avoid the risk associated with huge drawdowns, rather than seeking to consistently beat the market returns).
Most analyses I've seen toggle between +1 and 0, but in both cases they are missing a lot of other factors that leverage-varying investors will use in the real world. For example, given that the long term drift of SPX is distinctly positive, why not set the positions at something like +1.5 and -0.5 instead? Why not factor in a long term metric such as an adjusted version of the Buffett indicator or the CAPE?
What a sound leverage-varying index investment strategy will do is to avoid the huge drawdowns associated with periods after the peaks of 1929, 2000, & 2008 (and God forbid, something like the 1989 peak of the Nikkei). Using a long term metric would have signaled to a leverage-varying investor that the Death Cross from 1987 was not worth worrying much about--certainly not worth toggling leverage all the way to -1.
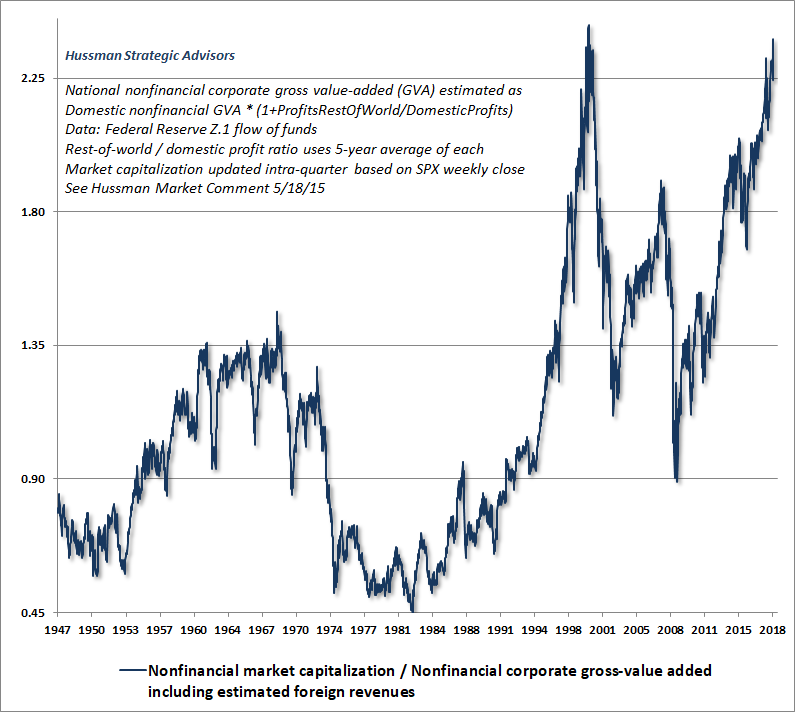
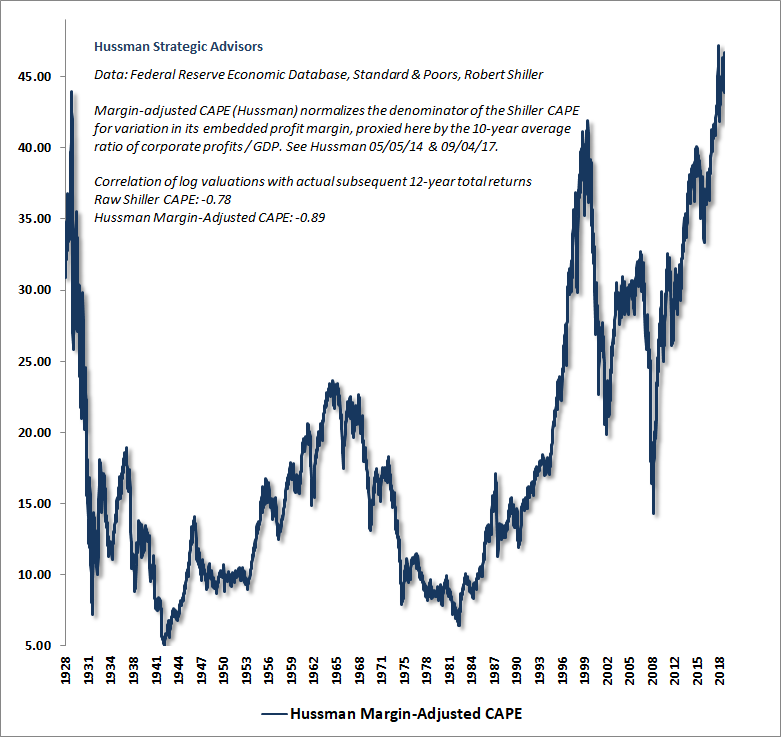
Just look at my favorite two 10-12-year metrics from John P. Hussman, the nonfin market cap / nonfin GVA metric (basically a modified version of the Buffet indicator), and the corporate-profit-cycle-adjusted-CAPE (an improved version of Shiller's CAPE).
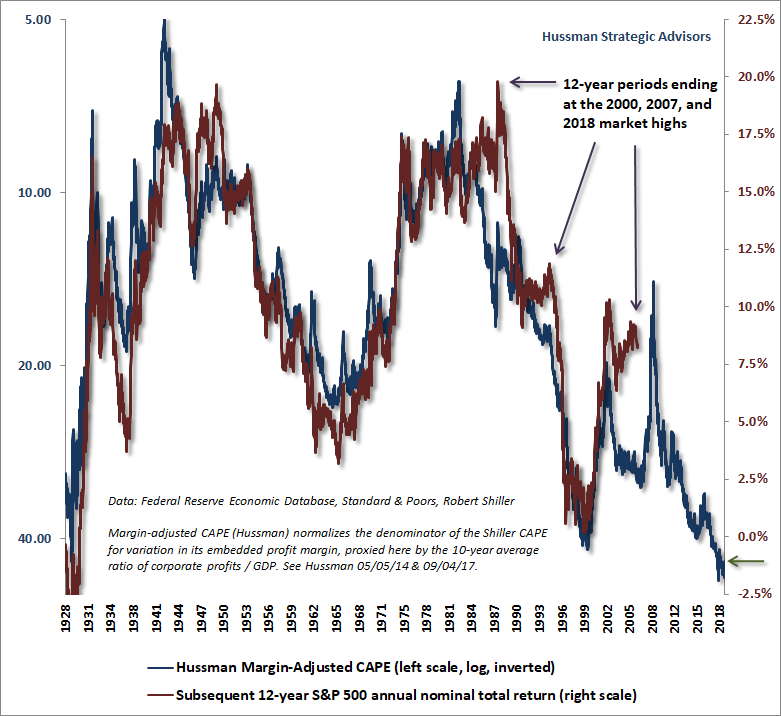
These long term metrics (which have better statistical correlations than 200-day-based momentum statistics) would warn an investor most strongly about the Death Crosses occurring after the 1929, 2000, & 2018, peaks, and would have been a little bit more moderate in warning about the Death Crosses occurring after the 1968 and 2007 peaks. They would have also signaled to a long term leverage-varying investor not to worry about the Death Cross from 1987 at all.
The warning is strongest right now, because we are currently in a situation most similar to Japan in 1989. Will it be that bad for us? No. We're not quite as bad off as the Japanese were, but still, looking at that modern example of monetary policy stimulating a bubble followed by deflation, more ZIRP, and gradual economic and demographic stagnation would be wise, given that we may well be at least partially the way there. It's a historical event lending credibility to a scenario occurring that could well be more extreme than anything captured in your 90-year range.
What is your methodology for buying the dips though? If your position is to advocate for passive investing over chasing better performance using market statistics, then you seem to be contradicting yourself if you advise people to buy on dips.
quote:
I adjusted a strategy script to buy long every Golden Cross and sell short every Death Cross. Exits only happen at opposing crosses.
quote:
The strategy appears to have outperformed SPX by about 11%, or 300 points, over a 90 year period. But the strategy doesn't account for fees, taxes, and slippage on orders. Those factors could turn the system into an underperformer. On the other hand, the system doesn't compound; all positions are +1 or -1.
This is remarkable.
I disagree strongly with your general conclusion, but I'm impressed that you have something showing an advantage. The geometric mean is the key result people look for, but seeing the variance on your 90-year study would be really interesting too (since the primary driver behind most 50d-200d strategies is to avoid the risk associated with huge drawdowns, rather than seeking to consistently beat the market returns).
Most analyses I've seen toggle between +1 and 0, but in both cases they are missing a lot of other factors that leverage-varying investors will use in the real world. For example, given that the long term drift of SPX is distinctly positive, why not set the positions at something like +1.5 and -0.5 instead? Why not factor in a long term metric such as an adjusted version of the Buffett indicator or the CAPE?
What a sound leverage-varying index investment strategy will do is to avoid the huge drawdowns associated with periods after the peaks of 1929, 2000, & 2008 (and God forbid, something like the 1989 peak of the Nikkei). Using a long term metric would have signaled to a leverage-varying investor that the Death Cross from 1987 was not worth worrying much about--certainly not worth toggling leverage all the way to -1.
Just look at my favorite two 10-12-year metrics from John P. Hussman, the nonfin market cap / nonfin GVA metric (basically a modified version of the Buffet indicator), and the corporate-profit-cycle-adjusted-CAPE (an improved version of Shiller's CAPE).
These long term metrics (which have better statistical correlations than 200-day-based momentum statistics) would warn an investor most strongly about the Death Crosses occurring after the 1929, 2000, & 2018, peaks, and would have been a little bit more moderate in warning about the Death Crosses occurring after the 1968 and 2007 peaks. They would have also signaled to a long term leverage-varying investor not to worry about the Death Cross from 1987 at all.
The warning is strongest right now, because we are currently in a situation most similar to Japan in 1989. Will it be that bad for us? No. We're not quite as bad off as the Japanese were, but still, looking at that modern example of monetary policy stimulating a bubble followed by deflation, more ZIRP, and gradual economic and demographic stagnation would be wise, given that we may well be at least partially the way there. It's a historical event lending credibility to a scenario occurring that could well be more extreme than anything captured in your 90-year range.
quote:
Honestly, though, they aren't that impressive. TL;DR: buy the dips, ignore the Death Cross boogeyman, bear markets are over once a Golden Cross appears.
What is your methodology for buying the dips though? If your position is to advocate for passive investing over chasing better performance using market statistics, then you seem to be contradicting yourself if you advise people to buy on dips.
Posted on 11/11/18 at 5:41 pm to Doc Fenton
quote:
warn an investor most strongly about the Death Crosses occurring after the 1929, 2000, & 2018, peaks
P.S. -- Of course I'm aware that the Death Cross for 2018 has not yet occurred, but we appear to be quickly approaching it, which is why I assume this thread was created. The spot price has been bobbing above-and-below the 200d MA the past month or so ( LINK), and moreover, the 50d MA has been bobbing above-and-below the 100d MA. If the S&P 500 dips down around 2,700 again for very long, we'll be at a Death Cross before too long.
This post was edited on 11/11/18 at 5:42 pm
Posted on 11/11/18 at 9:55 pm to Doc Fenton
There's a lot here to reply here; forgive me because I will jump around a bit.
Actually, I just recently learned enough about thinkorswim's automated backtesting abilities and thinkscript to adjust and test out strategies on a very basic level. I can't do too much because I'm not a programmer and don't understand programming language enough to do complex things (yet). However, by examining a few scripts, I was able to turn the default Golden Cross breakout script into the one I provided. I also adjusted the GC breakout script to buy GC's and go neutral at Death Crosses. As of close Friday, that strategy's profit was 2920.36, 160 points behind the GC-DC long-short strategy (SPX closed at 2781.01 and chart began at 17.76).
The two options that I'm aware of to determine position size only accept whole numbers, and having different sized longs and shorts requires editing the code.
As far as CAPE and the Buffett indicator go, if I don't have a thinkscript of them to look at, I can't include them in a strategy. For me, trying to code them would be like trying to bake a souffle in an easy bake oven.
The TL;DR was really for the buy and hold types here; they aren't likely to get into the nitty gritty trying to generate alpha or index-beating returns. So when I say buy the dips, I just mean that they should keep doing what many say they're doing: buying dips. I wouldn't advise them to wait to buy on GC's, for example, because several months or more than a year could pass before one happens, and they'd miss out on upside in the meantime. Likewise, I said to "ignore the Death Cross boogeyman" because only 30% of Death Crosses were profitable to short with the strategy (and it should be noted that 1 of those 14 profitable Death Crosses produced a whole 0.02 points). Plus, going neutral at a Death Cross would probably be worse than buy and hold due to taxes. I should have stated who I was speaking to, though.
But for you and me and anyone else actually interested enough in this to roll up their sleeves, there's more in the OP. I don't think the strategy, as shown, is that impressive, though. Like I said, taxes, fees, and slippage would have a negative effect on the strategy's outcome. I can't say how much because that would require accounting for those things in decades past. Also of note is that my chart only has daily open, high, low, and close data from 1962 onwards. Before then, I only have daily closes, which throws off the results a bit more when you consider that the strategy trades at the open, not close.
And when accounting for compounding, the GC-DC long-short strategy turns out to be a failure compared to buy and hold. The strategy would have produced a return of 10,090.05%. Buy and hold would've produced a return of either 15,414.92% (if starting from the beginning of the chart) or 12,848.54% (if starting when the GC-DC strategy first enters a position). Here's a spreadsheet I adjusted to compound the results.
quote:
Of course I'm aware that the Death Cross for 2018 has not yet occurred, but we appear to be quickly approaching it, which is why I assume this thread was created.
Actually, I just recently learned enough about thinkorswim's automated backtesting abilities and thinkscript to adjust and test out strategies on a very basic level. I can't do too much because I'm not a programmer and don't understand programming language enough to do complex things (yet). However, by examining a few scripts, I was able to turn the default Golden Cross breakout script into the one I provided. I also adjusted the GC breakout script to buy GC's and go neutral at Death Crosses. As of close Friday, that strategy's profit was 2920.36, 160 points behind the GC-DC long-short strategy (SPX closed at 2781.01 and chart began at 17.76).
quote:
why not set the positions at something like +1.5 and -0.5 instead?
The two options that I'm aware of to determine position size only accept whole numbers, and having different sized longs and shorts requires editing the code.
As far as CAPE and the Buffett indicator go, if I don't have a thinkscript of them to look at, I can't include them in a strategy. For me, trying to code them would be like trying to bake a souffle in an easy bake oven.
quote:
What is your methodology for buying the dips though? If your position is to advocate for passive investing over chasing better performance using market statistics, then you seem to be contradicting yourself if you advise people to buy on dips.
The TL;DR was really for the buy and hold types here; they aren't likely to get into the nitty gritty trying to generate alpha or index-beating returns. So when I say buy the dips, I just mean that they should keep doing what many say they're doing: buying dips. I wouldn't advise them to wait to buy on GC's, for example, because several months or more than a year could pass before one happens, and they'd miss out on upside in the meantime. Likewise, I said to "ignore the Death Cross boogeyman" because only 30% of Death Crosses were profitable to short with the strategy (and it should be noted that 1 of those 14 profitable Death Crosses produced a whole 0.02 points). Plus, going neutral at a Death Cross would probably be worse than buy and hold due to taxes. I should have stated who I was speaking to, though.
But for you and me and anyone else actually interested enough in this to roll up their sleeves, there's more in the OP. I don't think the strategy, as shown, is that impressive, though. Like I said, taxes, fees, and slippage would have a negative effect on the strategy's outcome. I can't say how much because that would require accounting for those things in decades past. Also of note is that my chart only has daily open, high, low, and close data from 1962 onwards. Before then, I only have daily closes, which throws off the results a bit more when you consider that the strategy trades at the open, not close.
And when accounting for compounding, the GC-DC long-short strategy turns out to be a failure compared to buy and hold. The strategy would have produced a return of 10,090.05%. Buy and hold would've produced a return of either 15,414.92% (if starting from the beginning of the chart) or 12,848.54% (if starting when the GC-DC strategy first enters a position). Here's a spreadsheet I adjusted to compound the results.
Posted on 11/12/18 at 9:35 pm to Omada
Yep. I have never done anything with thinkorswim scripts (and I haven't done any real coding in a few years), so it's the type of thing that I would like to get around to investigating more, but probably won't until mid-December... if I'm lucky.
That being said, I like the basic idea of what you've started here, which is why this is a really interesting thread to me.
Gotcha.
I brought it up, because by coincidence, I happen to be in the process of developing a holistic multi-cycle variable-leverage investment strategies based on long term, medium term, and short term metrics. So the 200-day metric would fall under my "medium term" category, and the modified CAPE and Buffett indicators would fall under my "long term" category.
It's part judgment-based, and thus not totally automated, but the more quantitative support you can have for the parameters of your strategy, the better.
Ehhh, it's debatable, but I certainly see your point.
I'm one of the few people who even mention Death Crosses as a useful indicator around here (LSUtoOmaha suggested it might be bullcrap a little less than a month ago), but even for me, it's only a small piece of my overall strategy.
My overarching point is that indicators such as the modified Buffett indicator and the 200-day momentum indicator ARE statistically significant (and thus represents useful information of some form), and this being the case, it logically stands to reason that it shouldn't be too difficult to devise a leverage-varying index investment strategy that beats the market.
We'll see how it goes, but in any case, thanks for the thread.

That being said, I like the basic idea of what you've started here, which is why this is a really interesting thread to me.
quote:
As far as CAPE and the Buffett indicator go, if I don't have a thinkscript of them to look at, I can't include them in a strategy. For me, trying to code them would be like trying to bake a souffle in an easy bake oven.
Gotcha.
I brought it up, because by coincidence, I happen to be in the process of developing a holistic multi-cycle variable-leverage investment strategies based on long term, medium term, and short term metrics. So the 200-day metric would fall under my "medium term" category, and the modified CAPE and Buffett indicators would fall under my "long term" category.
It's part judgment-based, and thus not totally automated, but the more quantitative support you can have for the parameters of your strategy, the better.
quote:
I don't think the strategy, as shown, is that impressive, though.
Ehhh, it's debatable, but I certainly see your point.
I'm one of the few people who even mention Death Crosses as a useful indicator around here (LSUtoOmaha suggested it might be bullcrap a little less than a month ago), but even for me, it's only a small piece of my overall strategy.
My overarching point is that indicators such as the modified Buffett indicator and the 200-day momentum indicator ARE statistically significant (and thus represents useful information of some form), and this being the case, it logically stands to reason that it shouldn't be too difficult to devise a leverage-varying index investment strategy that beats the market.
We'll see how it goes, but in any case, thanks for the thread.
Posted on 12/7/18 at 9:49 am to Doc Fenton


 Page 1 of 1


Popular
Back to top