- My Forums
- Tiger Rant
- LSU Recruiting
- SEC Rant
- Saints Talk
- Pelicans Talk
- More Sports Board
- Fantasy Sports
- Golf Board
- Soccer Board
- O-T Lounge
- Tech Board
- Home/Garden Board
- Outdoor Board
- Health/Fitness Board
- Movie/TV Board
- Book Board
- Music Board
- Political Talk
- Money Talk
- Fark Board
- Gaming Board
- Travel Board
- Food/Drink Board
- Ticket Exchange
- TD Help Board
Customize My Forums- View All Forums
- Show Left Links
- Topic Sort Options
- Trending Topics
- Recent Topics
- Active Topics
Started By
Message
re: An Examination of The Golden and Death Crosses
Posted on 11/11/18 at 5:36 pm to Omada

Posted on 11/11/18 at 5:36 pm to Omada
Have an upvote, sir.
This is remarkable.
I disagree strongly with your general conclusion, but I'm impressed that you have something showing an advantage. The geometric mean is the key result people look for, but seeing the variance on your 90-year study would be really interesting too (since the primary driver behind most 50d-200d strategies is to avoid the risk associated with huge drawdowns, rather than seeking to consistently beat the market returns).
Most analyses I've seen toggle between +1 and 0, but in both cases they are missing a lot of other factors that leverage-varying investors will use in the real world. For example, given that the long term drift of SPX is distinctly positive, why not set the positions at something like +1.5 and -0.5 instead? Why not factor in a long term metric such as an adjusted version of the Buffett indicator or the CAPE?
What a sound leverage-varying index investment strategy will do is to avoid the huge drawdowns associated with periods after the peaks of 1929, 2000, & 2008 (and God forbid, something like the 1989 peak of the Nikkei). Using a long term metric would have signaled to a leverage-varying investor that the Death Cross from 1987 was not worth worrying much about--certainly not worth toggling leverage all the way to -1.
Just look at my favorite two 10-12-year metrics from John P. Hussman, the nonfin market cap / nonfin GVA metric (basically a modified version of the Buffet indicator), and the corporate-profit-cycle-adjusted-CAPE (an improved version of Shiller's CAPE).
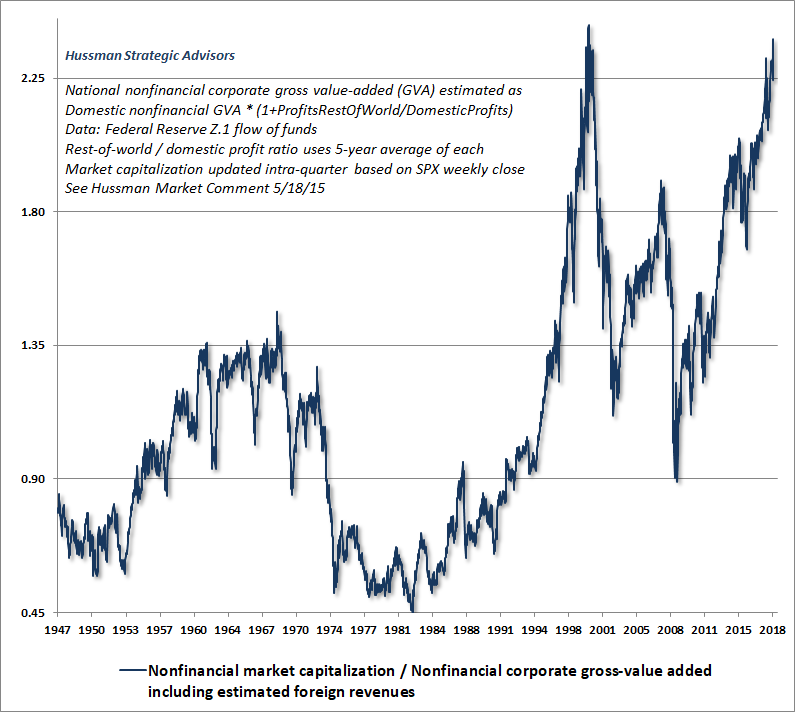
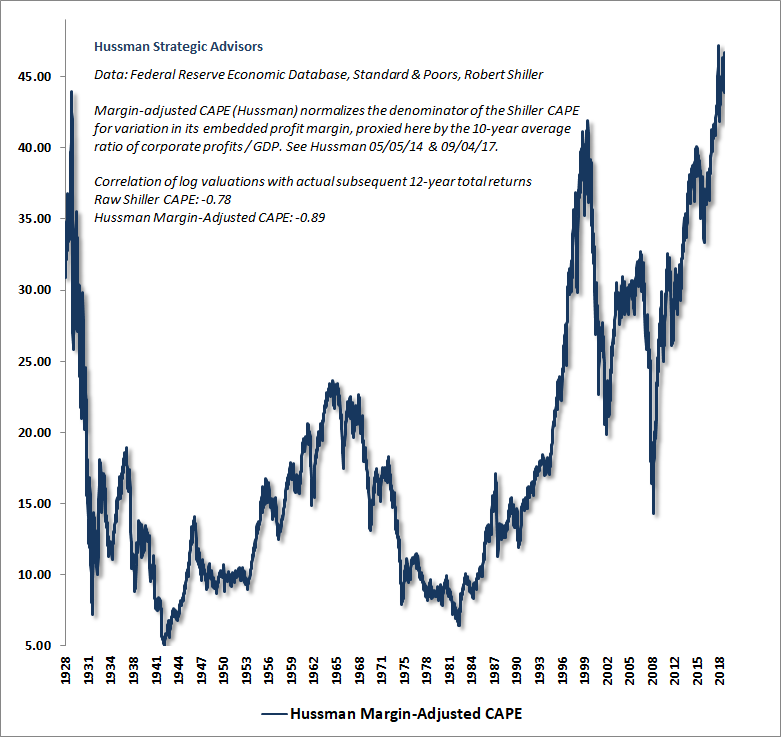
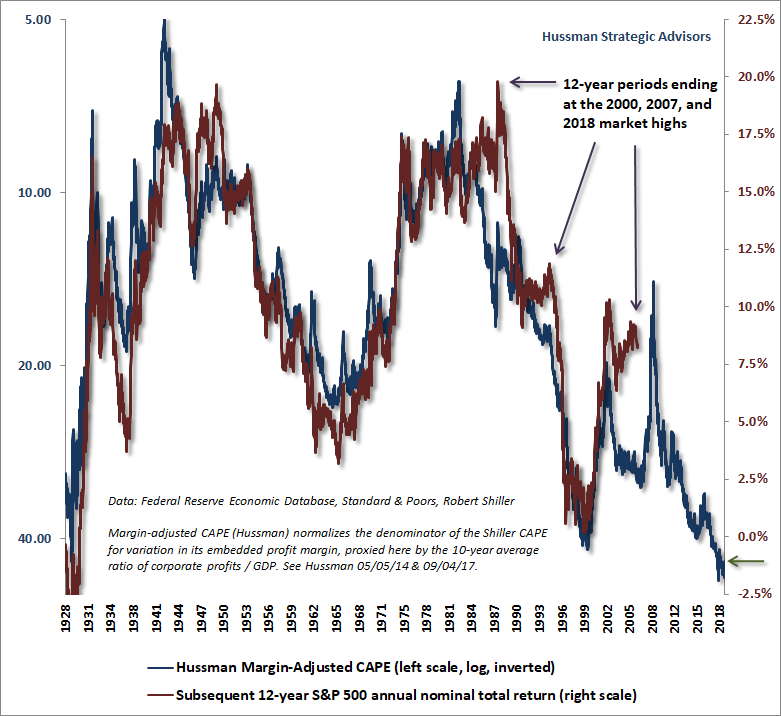
These long term metrics (which have better statistical correlations than 200-day-based momentum statistics) would warn an investor most strongly about the Death Crosses occurring after the 1929, 2000, & 2018, peaks, and would have been a little bit more moderate in warning about the Death Crosses occurring after the 1968 and 2007 peaks. They would have also signaled to a long term leverage-varying investor not to worry about the Death Cross from 1987 at all.
The warning is strongest right now, because we are currently in a situation most similar to Japan in 1989. Will it be that bad for us? No. We're not quite as bad off as the Japanese were, but still, looking at that modern example of monetary policy stimulating a bubble followed by deflation, more ZIRP, and gradual economic and demographic stagnation would be wise, given that we may well be at least partially the way there. It's a historical event lending credibility to a scenario occurring that could well be more extreme than anything captured in your 90-year range.
What is your methodology for buying the dips though? If your position is to advocate for passive investing over chasing better performance using market statistics, then you seem to be contradicting yourself if you advise people to buy on dips.
quote:
I adjusted a strategy script to buy long every Golden Cross and sell short every Death Cross. Exits only happen at opposing crosses.
quote:
The strategy appears to have outperformed SPX by about 11%, or 300 points, over a 90 year period. But the strategy doesn't account for fees, taxes, and slippage on orders. Those factors could turn the system into an underperformer. On the other hand, the system doesn't compound; all positions are +1 or -1.
This is remarkable.
I disagree strongly with your general conclusion, but I'm impressed that you have something showing an advantage. The geometric mean is the key result people look for, but seeing the variance on your 90-year study would be really interesting too (since the primary driver behind most 50d-200d strategies is to avoid the risk associated with huge drawdowns, rather than seeking to consistently beat the market returns).
Most analyses I've seen toggle between +1 and 0, but in both cases they are missing a lot of other factors that leverage-varying investors will use in the real world. For example, given that the long term drift of SPX is distinctly positive, why not set the positions at something like +1.5 and -0.5 instead? Why not factor in a long term metric such as an adjusted version of the Buffett indicator or the CAPE?
What a sound leverage-varying index investment strategy will do is to avoid the huge drawdowns associated with periods after the peaks of 1929, 2000, & 2008 (and God forbid, something like the 1989 peak of the Nikkei). Using a long term metric would have signaled to a leverage-varying investor that the Death Cross from 1987 was not worth worrying much about--certainly not worth toggling leverage all the way to -1.
Just look at my favorite two 10-12-year metrics from John P. Hussman, the nonfin market cap / nonfin GVA metric (basically a modified version of the Buffet indicator), and the corporate-profit-cycle-adjusted-CAPE (an improved version of Shiller's CAPE).
These long term metrics (which have better statistical correlations than 200-day-based momentum statistics) would warn an investor most strongly about the Death Crosses occurring after the 1929, 2000, & 2018, peaks, and would have been a little bit more moderate in warning about the Death Crosses occurring after the 1968 and 2007 peaks. They would have also signaled to a long term leverage-varying investor not to worry about the Death Cross from 1987 at all.
The warning is strongest right now, because we are currently in a situation most similar to Japan in 1989. Will it be that bad for us? No. We're not quite as bad off as the Japanese were, but still, looking at that modern example of monetary policy stimulating a bubble followed by deflation, more ZIRP, and gradual economic and demographic stagnation would be wise, given that we may well be at least partially the way there. It's a historical event lending credibility to a scenario occurring that could well be more extreme than anything captured in your 90-year range.
quote:
Honestly, though, they aren't that impressive. TL;DR: buy the dips, ignore the Death Cross boogeyman, bear markets are over once a Golden Cross appears.
What is your methodology for buying the dips though? If your position is to advocate for passive investing over chasing better performance using market statistics, then you seem to be contradicting yourself if you advise people to buy on dips.
 1
1

Posted on 11/11/18 at 5:41 pm to Doc Fenton
quote:
warn an investor most strongly about the Death Crosses occurring after the 1929, 2000, & 2018, peaks
P.S. -- Of course I'm aware that the Death Cross for 2018 has not yet occurred, but we appear to be quickly approaching it, which is why I assume this thread was created. The spot price has been bobbing above-and-below the 200d MA the past month or so ( LINK), and moreover, the 50d MA has been bobbing above-and-below the 100d MA. If the S&P 500 dips down around 2,700 again for very long, we'll be at a Death Cross before too long.
This post was edited on 11/11/18 at 5:42 pm

 Page 1 of 1


Popular
Back to top