- My Forums
- Tiger Rant
- LSU Recruiting
- SEC Rant
- Saints Talk
- Pelicans Talk
- More Sports Board
- Fantasy Sports
- Golf Board
- Soccer Board
- O-T Lounge
- Tech Board
- Home/Garden Board
- Outdoor Board
- Health/Fitness Board
- Movie/TV Board
- Book Board
- Music Board
- Political Talk
- Money Talk
- Fark Board
- Gaming Board
- Travel Board
- Food/Drink Board
- Ticket Exchange
- TD Help Board
Customize My Forums- View All Forums
- Show Left Links
- Topic Sort Options
- Trending Topics
- Recent Topics
- Active Topics
Started By
Message
International ETF's
Posted on 7/26/17 at 8:30 pm
Posted on 7/26/17 at 8:30 pm
I keep reading about India, China and Japan are at the beginning of a long bull run. Anyone mess with any ETF's dealing with this countries?
 9
9

Posted on 7/26/17 at 8:40 pm to FriscoTiger
vanguard emerging markets

Posted on 7/26/17 at 8:59 pm to FriscoTiger
VXUS is total international ETF
VWO is emerging markets
Japan won't be in emerging, so you'd have to use something like VEA with VWO if you splice and dice
VWO is emerging markets
Japan won't be in emerging, so you'd have to use something like VEA with VWO if you splice and dice
This post was edited on 7/26/17 at 9:00 pm

Posted on 8/1/17 at 9:39 pm to FriscoTiger
Nope. I've been following AFTY (for the FTSE/Xinhua A50 China index) for a couple of years ever since the crash in mainland Chinese stocks listed on the Shanghai and Shenzhen exchanges. It looks to be reasonably priced and enticing lately, but I just don't trust China right now. There are too many mixed, opaque signals over there that I just don't understand.
Coincidentally, I sold my last shares of UMX yesterday, which is a 2x bull ETF tracking the EWW index for Mexican stocks. Like I posted some months back, UMX was a great post-election buy at 17.20 on November 21, and I got out yesterday at 28.03, for a gain of 63%.
That more than made up for the two times that I dipped my toe in the water trying to buy SPX put options at the right time--once post-Brexit in July (betting that the post-Brexit bounce would run out of steam and slump back the other direction), and again in August trying to take a more long-term approach.
Having sputtered twice, this time I'm going to sit back and wait for the market to start crashing before I take any short positions, because it's just impossible to predict when the drop is going to occur. That being said, I am a big devotee of John P. Hussman's rigorous methodology ( LINK), and I think he's correct in saying that the S&P 500 will likely yield 0% returns over the next 10-12 years, and that there will likely be a market drop of at least 44% from current prices at some point before the end of this market cycle.
In any case, I am now 100% out of equities. The current U.S. market valuations are obscenely overpriced, and that makes the international environment almost as dangerous, if not more so in most cases.
Posted on 8/1/17 at 9:48 pm to FriscoTiger
Oh, and I would definitely be more keen to invest in India than Japan. INDA looks like it's only appreciated by about 33% over the last 5 years, and doing something like EWJ for Japan seems too dangerous to me.
India has an economy growing faster than China's, and will have the largest population in the world in a few decades. Japan, by contrast, is an extremely low growth economy with an elderly society on its last legs. Moreover, Japan is entering an experimental zone with monetary policy, and nobody knows how it will end up. It could get very, very bad over there.
India has an economy growing faster than China's, and will have the largest population in the world in a few decades. Japan, by contrast, is an extremely low growth economy with an elderly society on its last legs. Moreover, Japan is entering an experimental zone with monetary policy, and nobody knows how it will end up. It could get very, very bad over there.
Posted on 8/1/17 at 11:09 pm to Doc Fenton
Damn, nice job on the Mexico route, I remember when you posted about that. Wish I had time and knowledge to get more involved like that. Ill just have to stick to my ETFs for now. 

Posted on 8/2/17 at 12:17 pm to FriscoTiger
Schwab has a good one.
Posted on 8/2/17 at 5:33 pm to Doc Fenton
What a great article/essay. Is Hussman ever wrong on these general trends?
Posted on 8/2/17 at 6:17 pm to FriscoTiger
I've been overweight on India for several years. PIN.
I recently liquidated some emerging markets and moved it to Japan. HJPX. I did so after reading some analysis put out by Stringer Asset Management.
I recently liquidated some emerging markets and moved it to Japan. HJPX. I did so after reading some analysis put out by Stringer Asset Management.
Posted on 8/2/17 at 7:14 pm to LSUtoOmaha
His General Record
I read Hussman's Weekly Market Comment religiously every Monday, and he does put together some great stuff (although a lot of the material gets repeated). The gist of his story is that he got high praise for correctly cautioning investors to rebalance out of equities in 2000 and 2007 going into the two big financial crises. (See some selected quotes in his weekly report from 5/29/17.) He gets labeled a "permabear" sometimes, but he actually advocates for a constructive outlook on U.S. equities about 80% of the time. For example, he was constructive on U.S. equities as early as October 2008, once it had already lost over 40% of its value from the October 2007 peak, and when almost everyone else was still panicking.
His Biggest Mistake
However, he did make a blunder in 2014, and he brings it up nearly every Monday in his weekly reports. It's almost masochistic self-flagellation, but he does it to thoroughly explain to outside readers what happened, why it happened, and why his model has improved by taking that experience into account.
Basically, his mistake was that he stress tested his model against Depression Era data, which led him to assert that market conditions had deteriorated far earlier than they actually did--i.e., he called the 3rd market crash too early.
From 5/22/17 ( LINK):
From 6/19/17 ( LINK):
From 7/3/17 ( LINK):
...
I read Hussman's Weekly Market Comment religiously every Monday, and he does put together some great stuff (although a lot of the material gets repeated). The gist of his story is that he got high praise for correctly cautioning investors to rebalance out of equities in 2000 and 2007 going into the two big financial crises. (See some selected quotes in his weekly report from 5/29/17.) He gets labeled a "permabear" sometimes, but he actually advocates for a constructive outlook on U.S. equities about 80% of the time. For example, he was constructive on U.S. equities as early as October 2008, once it had already lost over 40% of its value from the October 2007 peak, and when almost everyone else was still panicking.
His Biggest Mistake
However, he did make a blunder in 2014, and he brings it up nearly every Monday in his weekly reports. It's almost masochistic self-flagellation, but he does it to thoroughly explain to outside readers what happened, why it happened, and why his model has improved by taking that experience into account.
Basically, his mistake was that he stress tested his model against Depression Era data, which led him to assert that market conditions had deteriorated far earlier than they actually did--i.e., he called the 3rd market crash too early.
From 5/22/17 ( LINK):
quote:
It's at that point that I shot myself in the heel. My 2009 insistence on stress-testing our methods against Depression-era data led us to overemphasize a historical regularity (relating to “overvalued, overbought, overbullish” conditions) that was reliable in prior market cycles across history, but ultimately did not hold in the presence of zero interest rates. Correcting that error revealed a lot about the underlying truth: the psychological preferences of investors toward risk matter, regardless of how extreme valuations become, and even regardless of entire syndromes of extreme conditions. Just as in the tech bubble and the mortgage bubble, there is no substitute for an explicit focus on the status of market internals, as a gauge of investor psychology.
From 6/19/17 ( LINK):
quote:
I’ll say this once again. Our Achilles Heel in the advancing portion of this cycle was straightforward: in prior market cycles across history, the emergence of extreme overvalued, overbought, overbullish syndromes had an urgency that preceded even the behavior of market internals. Quantitative easing disrupted that regularity. But even since 2009, the S&P 500 has lost value, on average, in periods that joined rich valuation, “overvalued, overbought, overbullish” syndromes, and deterioration in the uniformity of market internals. That’s the combination we currently observe, and our market outlook will shift as the evidence does.
From 7/3/17 ( LINK):
quote:
If one limits exposure to market risk here, when does one expand that exposure? From our perspective, the strongest market return/risk profiles we identify emerge at the point where a material retreat in valuations is joined by an early improvement in our measures of market action. My label as a permabear is the inadvertent result of my 2009 insistence on stress-testing our methods against Depression-era data, which truncated our late-October 2008 shift to a constructive outlook (after the market had collapsed by more than 40%), and introduced a particular vulnerability in the face of the Federal Reserve's deranged zero-interest rate policies. Having addressed that vulnerability in 2014, it may be useful to recall that I've encouraged a constructive or aggressive market outlook after every bear market decline in over three decades as a professional investor.
For example, in October 1990, I wrote "With the market nearly 20% off its highs, it is rather easy to say that stocks are in a 'bear market.' However, this type of label is simply a snapshot, and says nothing about future prospects for the market... Investors wishing to wait until the Gulf crisis and budget problems are resolved will have to buy at significantly higher prices. Reestablish a 100%, fully invested position." Several months later, I encouraged a leveraged investment outlook. Similar, though less aggressive shifts followed the 2000-2002 collapse and the market plunge in 2008. As value-conscious investors, bubble valuations have often been challenging for us, and there's no question that the difficult narrative following my 2009 insistence on stress-testing derailed the reputation I had established in previous complete market cycles up to that point. But speculators who insist on dismissing concerns about valuations and market risk because of my own challenges in this half-cycle are likely to learn some very hard lessons of their own in the coming years.
...
Posted on 8/2/17 at 7:15 pm to Doc Fenton
...
His Most Valuable Contribution
His bread-and-butter is the long-term valuation model for predicting investor returns in U.S. equities over a 10-12 year horizon. He uses market-cap-to-GVA as his basic indicator, which has a greater R^2 than any other known statistic--better than Shiller's CAPE, better than the Buffett Indicator (market-cap-to-GDP), better than Tobin's Q.... better than all of them. (See the weekly report from 3/6/17.)
What Are the Differences Among "Overvalued", "Overbought", and "Overbullish"?
This confused me for quite a while when I first started reading Hussman's Weekly Market Comment on Mondays. Here's the breakdown for you:
overvalued -- This is his basic bread-and-butter long-term valuation stuff, using his non-fin-market-cap-to-corp-GVA statistic to predict 10-12-year return prospects for investors with a quite high R^2. As he points out often, however, a market being overvalued doesn't tell you very much about what it's going to do over the next 1-2 years. So that's where the other stuff comes into play.
overbought -- This is the classic technical analysis type of stuff, such as Bollinger bands and the like. Hussman made a mistake in relying too much on technicals in 2014 to advise his clients to rebalance away from U.S. equities, and now fully admits that he gave this advice too early.
He now recognizes that overbought conditions are practically useless for detecting deteriorating market conditions in a near-ZIRP monetary policy environment, and that one must also look for unfavorable "market internals" before shifting to a hard negative outlook on the near-term market. What exactly are unfavorable market internals? They have to do with the level of internal dispersion among different risk categories of assets. For example, when different types of bonds start having divergent spreads to the base U.S. Treasury yield, then you have greater "internal dispersion", and thus more unfavorable "market internals." The theory behind this is that when investors are risk-seeking, they tend to be indiscriminate about it, and this is a bullish signal. Conversely, when investors are risk-averse, they tend to be very discriminate about the risk levels of their assets, and this is a bearish signal.
overbullish -- This is mostly measured by market sentiment, and is considered a contrarian indicator. Note that having "smart money" start to pile into put options is not considered a contrarian indicator. The contrarian part is having a high percentage of ordinary investment advisors with bullish outlooks for U.S. stocks. If I'm not mistaken, I think that the degree of margin debt per investment dollar in retail investment accounts might also fall into this category.
Finally, there's that crazy Sornette log-periodic bubble modeling stuff (which has been predicting a market top in early August), but that's for illustrative purposes, and is mostly just Hussman playing around with different ideas for fun.
Posted on 8/2/17 at 7:45 pm to Doc Fenton
Vanguard VEA and VWO (Emerging and Developed Markets) ETF's have been doing well this year. I own both and they have done a few % better than all my US investments
Posted on 8/3/17 at 9:30 am to Doc Fenton
Doc,
Just to play Devil's Advocate, a counter hypothesis could be that bond yield to stock ratios indicate that, in terms of that trade off, stock are properly valued to what corporate bonds are yielding.
Hussman stated that quantitative easing was a reason for why his valuations were not completely appropriate, I think in the 2009 time frame.
What are your thoughts on that?
Posted on 8/3/17 at 7:20 pm to LSUtoOmaha
For the sake of efficiency, allow me to use the made-up term "overdispersed" for Hussman's notion of unfavorable market internals with high dispersion, which he believes is a bearish indicator.
I don't think that Hussman's metrics for overdispersion relate to the bond yield relative to stock ratios. Indeed, he makes the point repeatedly that interest rates have very little to do with projecting future returns on equities.
When market internals are overdispersed, that doesn't mean that bond yields are low relative to stocks. Rather, it means (if I'm understanding him correctly) that low-grade bonds are not well differentiated from high-grade bonds, that covenant-light bonds are not well differentiated from covenant-heavy bonds, etc.
It's hard to know the exact concrete details of what goes into his metrics overdispersion, because it's proprietary, and he only discusses it generally, but I am guessing that it also takes into account dispersion within a single asset class (and not just bonds). So if all junk bonds (or S&P 500 stocks) move in tandem, then there would not be much intra-class dispersion. But if 15% of junk bonds (or S&P 500 stocks) suddenly drop below or rise below the rest of the pack, then you have greater dispersion--i.e., greater risk discrimination by investors, who are being careful about researching the specifics of individual securities, rather than simply passively investing in certain classes of assets.
No. I think I may have been trying to explain too much at one time with my earlier post, and didn't communicate these concepts as well as I could have done.
Hussman's valuations have never been wrong. That's his bread-and-butter stuff, the statistic (non-financial market capitalization / corporate gross-value-added) that models nominal returns over the next 12 years. I'm pretty sure that whatever his statistic was for 2005 has predicted returns to the present day fairly well.
But like I wrote in my earlier post, "a market being overvalued doesn't tell you very much about what it's going to do over the next 1-2 years." But Hussman runs money with actual funds (he now does it as non-profits), so he has to attempt to give shorter-term market outlooks than 10-12-year projections, and that's where things get difficult.
(By the way, he didn't really "call a market crash" in 2014; that was just me being lazy with my words and using sloppy language to convey that he had a "hard negative" market outlook at that time. As he's often explained, when he gives negative market outlooks, that doesn't really predict investor returns over the next day, or even the next 2-3 years. It only means that the probability distribution for daily returns starts to have very fat left-tail events in it, and that over the completion of a 12-year cycle, valuations look poor.)
Prior to 2014, this (in general terms, since a lot of the details are proprietary secrets) is how Hussman came up with his negative market outloooks:
overvalued + overbought + overbullish = hard negative
There was nothing at all wrong with the "overvalued" part. As far we know, the 10-12-year projections from 2014 will prove just as correct in the year 2026 as they always have. I doubt the "overbullish" was the problem either. It was the "overbought" part that seems to me to have been the source of his problems... relying on too much T.A. mumbo jumbo about Bollinger bands and candlestick charts and shapes and the like. (I don't even know what particular metrics he uses for his technical analysis, because he never really discusses it in any detail... other than to say that it used to work for Depression Era historicals, but doesn't work in a near-ZIRP environment.)
So after his blunder in 2014, he came back with new requirements before taking a hard negative market outlook. The formula now looks like this:
overvalued + overbought + overbullish + overdispersed = hard negative
And, really, like I mentioned above, I think the "overbought" stuff is mostly mumbo jumbo, so he might as well use the following:
overvalued + overdispersed + overbullish = hard negative
That probably does a good job at informing investors regarding what percentage of their assets should be allocated to U.S. equities, based upon their own particular situations and preferences. In theory, there is no lower or upper limit to this stuff. It can go into negative territory if you're short, and if you are leveraged long (which Hussman has recommended at certain points in time), then you can push beyond the 100% barrier.
Hope that helps. This stuff can be confusing at first, like stepping into a whole other universe.

quote:
a counter hypothesis could be that bond yield to stock ratios indicate that, in terms of that trade off, stock are properly valued to what corporate bonds are yielding.
I don't think that Hussman's metrics for overdispersion relate to the bond yield relative to stock ratios. Indeed, he makes the point repeatedly that interest rates have very little to do with projecting future returns on equities.
When market internals are overdispersed, that doesn't mean that bond yields are low relative to stocks. Rather, it means (if I'm understanding him correctly) that low-grade bonds are not well differentiated from high-grade bonds, that covenant-light bonds are not well differentiated from covenant-heavy bonds, etc.
It's hard to know the exact concrete details of what goes into his metrics overdispersion, because it's proprietary, and he only discusses it generally, but I am guessing that it also takes into account dispersion within a single asset class (and not just bonds). So if all junk bonds (or S&P 500 stocks) move in tandem, then there would not be much intra-class dispersion. But if 15% of junk bonds (or S&P 500 stocks) suddenly drop below or rise below the rest of the pack, then you have greater dispersion--i.e., greater risk discrimination by investors, who are being careful about researching the specifics of individual securities, rather than simply passively investing in certain classes of assets.
quote:
Hussman stated that quantitative easing was a reason for why his valuations were not completely appropriate, I think in the 2009 time frame.
No. I think I may have been trying to explain too much at one time with my earlier post, and didn't communicate these concepts as well as I could have done.
Hussman's valuations have never been wrong. That's his bread-and-butter stuff, the statistic (non-financial market capitalization / corporate gross-value-added) that models nominal returns over the next 12 years. I'm pretty sure that whatever his statistic was for 2005 has predicted returns to the present day fairly well.
But like I wrote in my earlier post, "a market being overvalued doesn't tell you very much about what it's going to do over the next 1-2 years." But Hussman runs money with actual funds (he now does it as non-profits), so he has to attempt to give shorter-term market outlooks than 10-12-year projections, and that's where things get difficult.
(By the way, he didn't really "call a market crash" in 2014; that was just me being lazy with my words and using sloppy language to convey that he had a "hard negative" market outlook at that time. As he's often explained, when he gives negative market outlooks, that doesn't really predict investor returns over the next day, or even the next 2-3 years. It only means that the probability distribution for daily returns starts to have very fat left-tail events in it, and that over the completion of a 12-year cycle, valuations look poor.)
Prior to 2014, this (in general terms, since a lot of the details are proprietary secrets) is how Hussman came up with his negative market outloooks:
overvalued + overbought + overbullish = hard negative
There was nothing at all wrong with the "overvalued" part. As far we know, the 10-12-year projections from 2014 will prove just as correct in the year 2026 as they always have. I doubt the "overbullish" was the problem either. It was the "overbought" part that seems to me to have been the source of his problems... relying on too much T.A. mumbo jumbo about Bollinger bands and candlestick charts and shapes and the like. (I don't even know what particular metrics he uses for his technical analysis, because he never really discusses it in any detail... other than to say that it used to work for Depression Era historicals, but doesn't work in a near-ZIRP environment.)
So after his blunder in 2014, he came back with new requirements before taking a hard negative market outlook. The formula now looks like this:
overvalued + overbought + overbullish + overdispersed = hard negative
And, really, like I mentioned above, I think the "overbought" stuff is mostly mumbo jumbo, so he might as well use the following:
overvalued + overdispersed + overbullish = hard negative
That probably does a good job at informing investors regarding what percentage of their assets should be allocated to U.S. equities, based upon their own particular situations and preferences. In theory, there is no lower or upper limit to this stuff. It can go into negative territory if you're short, and if you are leveraged long (which Hussman has recommended at certain points in time), then you can push beyond the 100% barrier.
Hope that helps. This stuff can be confusing at first, like stepping into a whole other universe.
Posted on 8/3/17 at 7:56 pm to Doc Fenton
Thanks, that makes sense. So basically the theory is that when items within an asset class are moving all over the place, not in sync, then it is an indicator that the asset class will probably have a downward future
Posted on 8/3/17 at 8:05 pm to LSUtoOmaha
For the most part. I would use more careful language, and say that when assets within a class are moving all over the place, that's typically a precondition for a big drop (or at least greatly increases the probability of left-tail events).
If you're holding a security over a 10-12-year period, of course, then it doesn't matter whether there is overdispersion--only the valuation metrics matter.
If you're holding a security over a 10-12-year period, of course, then it doesn't matter whether there is overdispersion--only the valuation metrics matter.
Posted on 8/3/17 at 8:25 pm to Doc Fenton
Got it. Thanks
What do you make of current US equity metrics relative to historic metrics?
One anecdote: I saw price sales of the S&P is at an all time high
What do you make of current US equity metrics relative to historic metrics?
One anecdote: I saw price sales of the S&P is at an all time high
Posted on 8/3/17 at 8:46 pm to LSUtoOmaha
Going by the famous Shiller CAPE (use the link in the 2nd paragraph at Shiller's Online Data to download his Excel file), it's now at about 30.49, just a tad below the September 1929 peak of 32.56. Now some might say, "Well it might still have room to run, because it got even higher in December 1999 when it hit 44.20."
However, that doesn't take into account several factors that can improve upon the Shiller CAPE metric, and under the improved metric from Hussman, things look much, much worse. Hussman's metric takes into account the corporate profit levels, which was famously noted to be "the most mean-reverting series in finance" by Jeremy Grantham in November 2014. The following graph from his Monday, July 24, weekly report tells you all you need to know:
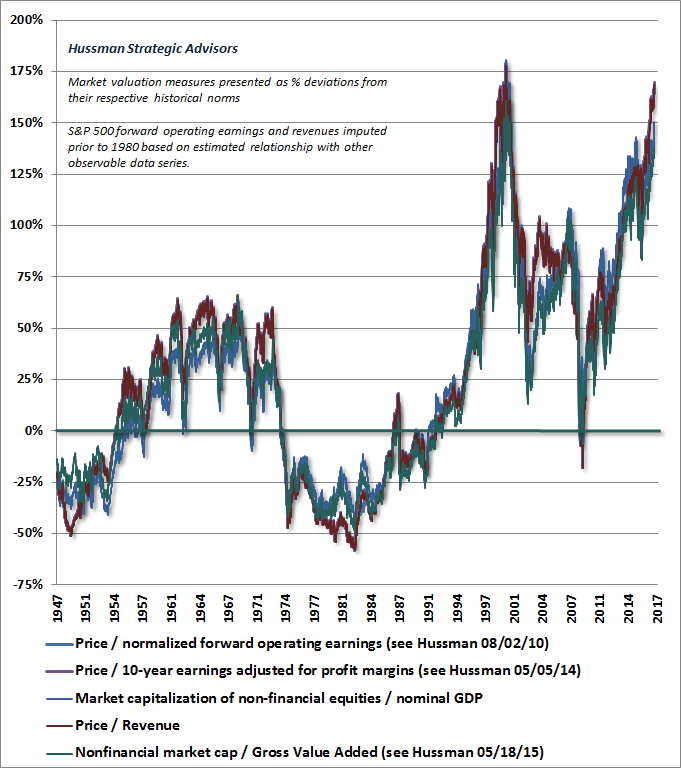
We are now (as of 7/31/17) at 178% above the norm, and completions of the market cycle have always brought the metric under 50% above the norm... so there's a lot of room to drop. As Hussman wrote on 7/24/17...
Caveat emptor.
However, that doesn't take into account several factors that can improve upon the Shiller CAPE metric, and under the improved metric from Hussman, things look much, much worse. Hussman's metric takes into account the corporate profit levels, which was famously noted to be "the most mean-reverting series in finance" by Jeremy Grantham in November 2014. The following graph from his Monday, July 24, weekly report tells you all you need to know:
We are now (as of 7/31/17) at 178% above the norm, and completions of the market cycle have always brought the metric under 50% above the norm... so there's a lot of room to drop. As Hussman wrote on 7/24/17...
quote:
On that note, it’s worth noting that the Shiller CAPE reached 30 last week, which places current valuations among the highest 3% of historical observations, on that particular measure. In reality, however, the situation is much more extreme. While some observers take solace in the fact that the CAPE reached a much higher level of 44 at the 2000 bubble peak, that historical comparison ignores the embedded margin. See, at the 2000 peak, the embedded margin of the CAPE was just 5.1%, compared with a historical norm of 5.4%. At present, because of depressed wages and high profit margins in recent years (which are now reversing given a 4.4% unemployment rate), the CAPE quietly embeds a profit margin of 7.2%. Put another way, investors are currently paying a very high multiple of a very high earnings number that quietly benefits from cyclically elevated profit margins. On the basis of normalized profit margins (an adjustment that improves historical reliability), the normalized CAPE would presently be 40. There is only a single week in history where the normalized CAPE was higher. That was the week of March 24, 2000, when the S&P 500 hit its final bubble peak, at a normalized CAPE of 41.
Caveat emptor.
Posted on 8/3/17 at 9:14 pm to Doc Fenton
That is pretty damning evidence. Hmm. How long have you been in all cash?
Posted on 8/3/17 at 9:25 pm to LSUtoOmaha
Since I sold my last shares of Mexican stocks on July 31.
I have been completely out of U.S. equities since 2015.
My plan is to let the S&P 500 make its drop, then wait for the 50d SMA to cross back above the 200d SMA (don't try to get the bottom timing exactly correct and risk catching a falling knife), and then leverage up to the gills with something like TNA for the long-haul. Hopefully that will allow me to sit back and leave all this market watching crap alone for a very long time (i.e., around 10 years or so).

 Page 1 of 3

Popular
Back to top