- My Forums
- Tiger Rant
- LSU Recruiting
- SEC Rant
- Saints Talk
- Pelicans Talk
- More Sports Board
- Fantasy Sports
- Golf Board
- Soccer Board
- O-T Lounge
- Tech Board
- Home/Garden Board
- Outdoor Board
- Health/Fitness Board
- Movie/TV Board
- Book Board
- Music Board
- Political Talk
- Money Talk
- Fark Board
- Gaming Board
- Travel Board
- Food/Drink Board
- Ticket Exchange
- TD Help Board
Customize My Forums- View All Forums
- Show Left Links
- Topic Sort Options
- Trending Topics
- Recent Topics
- Active Topics
Started By
Message
re: International ETF's
Posted on 8/3/17 at 9:28 pm to Doc Fenton
Posted on 8/3/17 at 9:28 pm to Doc Fenton
Nice. Well I hope you are right. I'm convinced and am 100% cash. But don't hold the burden, I also have my gut telling me we are in a period of irrational exuberance.
This post was edited on 8/3/17 at 9:29 pm
 1
1


Posted on 8/3/17 at 9:38 pm to LSUtoOmaha
Yeah. The big problem here is that there isn't any catalyst to shift investor sentiment from being risk-indiscriminate to risk-averse. The Fed is scared as a cat, and its schedule for unwinding assets is timid.
Not only that, but a huge part of what's keeping the prices of U.S. stocks so high right now is QE by central banks in foreign countries. For instance, did you know that the Swiss National Bank currently has about $80 billion in U.S. stock holdings? That's about $10,000 invested in U.S. stocks for every citizen... and that's only the public part, not counting the private investments of individuals.
It seems weird that they would print money to buy U.S. stocks, but what else are they going to do? They have to print money, or else their currency would appreciate too quickly against the Euro, and wreck their trade-based economy. And they have too much wealth to invest it all in domestic assets (their real estate is already bubbly). And they would be dumb to invest in European stocks, because the idea is to diversify away from things directly linked to their own national economy.
Now take the isolated case of Switzerland and the SNB, and then consider the case of the ECB, the BOJ, the FRB, the BOE, etc. It all adds up.
The recent run-ups in the U.S. stock market have not come from traditional domestic professional asset managers, but rather have come from a high percentage of debt-financed corporate share repurchases and foreign sources. The former have started to wane, but the foreign sources seem capable of propping up these market prices for a bit longer.
Posted on 8/3/17 at 9:56 pm to Doc Fenton
Is a reasonable question: How long will it take for there to be a viable alternative to US equities? Some other security has to become more attractive right?
Posted on 8/3/17 at 10:00 pm to LSUtoOmaha
To be honest, equities still look attractively valued to me for Mexico (even though I just sold), China (with some reservations), and India. Unlike U.S. equities, I don't think any of those choices would be a bad buy-and-hold proposition over the next 10-12 years. In that sense, I sold because I'm doing some profit-taking and holding up for the coming short-term (18-24 months?) storm. Maybe I shouldn't time like that, but it is what I'm doing at the moment.
However, I like that this thread was created, because it really made me start thinking about those India stocks...
However, I like that this thread was created, because it really made me start thinking about those India stocks...
Posted on 8/3/17 at 10:24 pm to Doc Fenton
While this might be a pretty simple thought as to why stocks keep rising. Do you think that the older folks are dying out and people are just not seeing bonds as they once were. Everyone wants to get in stocks these days. The only ppl buying bondsthat are younger are ppl that aren't knowledgeable and letting an Edward price do their investing. Most younger ppl I know are starting to think bonds are for birds. Times are changing. Ppl are buying into stocks in the younger crowd. I think the same is with other countries that see the value in the us stock market. It'll drop hard at some point no doubt. But it'll recover.
Posted on 8/3/17 at 10:34 pm to thatguy777
quote:
Most younger ppl I know are starting to think bonds are for birds.
Given our recent deranged monetary policy, bonds are for the birds. That's the crux of the problem... and it's global in nature.
quote:
It'll drop hard at some point no doubt. But it'll recover.
True enough, but my biggest fear is that we are following the historical example of Japan over the past 30 years, which is not a good one. Japan's example shows that even in near-ZIRP conditions, big market corrections can happen, and continually low interest rates (plus direct equity purchases, in Japan's case) are no guarantee of sustained returns on equity.
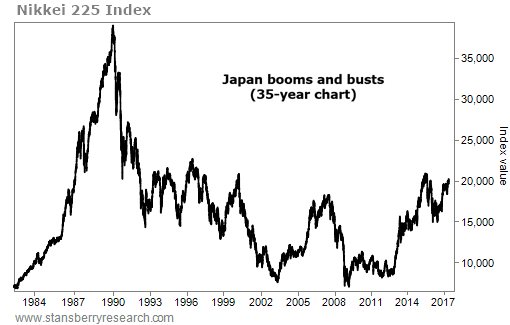
Now don't get me wrong--I know that the U.S. is not even remotely in as bad of shape as Japan was in 1990. That being said, even the slightest resemblance to 1990 Japan worries the crap out of me.
In reality, I expect that U.S. stocks will be a great value buy again as soon as 2019.
Posted on 8/3/17 at 10:41 pm to Doc Fenton
Let us know when you go short
Posted on 8/3/17 at 10:44 pm to Doc Fenton
I've read this entire thread. I just see that things are changing and while I'm not all that young I know ppl are changing their ways. Ppl might freak out at the stock market and now go to cryptos. Just don't see bond being all that relevant in the future. Ppl have other ways of storing money than making 2.5% or whatever it is. While that could go up it won't significantly. I just think ppl have diff views worldwide on money and while it's not near a majority at this point it will keep growing. I agree with most of what you say but I do not see a Japan happening here. No one is moving there and everyone wants to be in the us. Ppl pour money into this country non stop. Japan is old old. Us is new new
ETA: long term outlook 10,000 ft and all
ETA: long term outlook 10,000 ft and all
This post was edited on 8/3/17 at 10:52 pm
Posted on 8/4/17 at 10:57 am to Doc Fenton
Posted on 8/4/17 at 3:00 pm to Doc Fenton
quote:
My plan is to let the S&P 500 make its drop, then wait for the 50d SMA to cross back above the 200d SMA (don't try to get the bottom timing exactly correct and risk catching a falling knife)
Why? What are you dong in the meantime?
If you purchased SPY when the 50-day SMA moved below the 200-day SMA in September 2008, you'd have made 9.92% cumulative and 4.09% annualized by the time the 50-day SMA moved back above the 200-day SMA in January 2011.
To be fair, if you bought it in June 2001, you'd have lost 1.83% cumulatively and -.66% annualized by the time it crossed back above in April 2004. However, the S&P 500 returned 23.3% in the ~5 months the 50-day SMA was below the 200-day SMA in 1982, which is 87.5% annualized.
They don't cross often, but history would suggest you're better off getting in when they cross with a sell signal than you are waiting for the buy signal.
Posted on 8/4/17 at 7:44 pm to slackster
quote:
by the time the 50-day SMA moved back above the 200-day SMA in January 2011
Huh? I thought the "golden cross" occurred in June 2009.
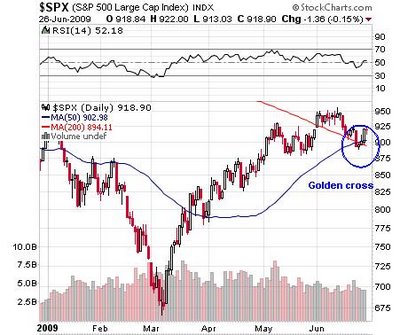
But you're right that it might not be a good rule to follow too strictly. I may have posted that too quickly without thinking through the ramifications. Honestly, I don't have a hard rule for when I'm going to go long the S&P 500, but I'm confident in my ability to get in somewhere reasonably close to the bottom... or at least somewhere well below 1800.
Since I'm a big fan of Hussman, I'll keep reading his reports until he turns constructive on the market. Based on past history, he tends to turn bullish early (before the bottom trough), and I tend to turn bullish late (a month or two after the trough). A careful investor is early to leave, and late to return.
“I will tell you my secret if you wish. It is this: I never buy at the bottom and I always sell too soon.” --
Baron Rothschild (according to Jesse Livermore recalling an encounter)
Posted on 8/4/17 at 8:01 pm to LSUtoOmaha
Wow. Sweet link. Thanks!
I've never seen a financial reference to dispersion before, outside of reading Hussman refer to it in his weekly reports. Now I'm really curious as to how broadly he does it--does he measure dispersion for a multi-asset mixed portfolio? for just the S&P 500? for several different asset classes in isolation?
I like how that chart on pg. 5 illustrates how dispersion gave a clear bearish signal in early 2000, when the VIX was actually dropping, and also how a couple of flash-crash types of events in 2010 and 2011 didn't register any false positives with the dispersion indicator.
For those interested in the "overbought" technical indicators, there's a good summary page at barchart.com, and some Wikipedia reading on the stochastic oscillator. I just can't get into it though.
Valuation metrics, Fama-French value and momentum factors, volatility metrics... all this stuff is taught at a high level in finance schools everywhere. Outside of a handful of eccentric mathematics courses on Elliott Wave Theory or something like that, nobody seems to teach any of the technical analysis stuff in reputable finance programs, and I think that's for a reason.
Posted on 8/4/17 at 10:26 pm to FriscoTiger
Pardon me for having hijacked your thread somewhat, but to get back on the subject of international stocks, I did some quick research and found a couple of interesting sites.
Here ( LINK) is a German one from Star Capital, that shows several valuation metrics for different countries across the world. It uses Shiller's CAPE, P/E, P/CF, P/Book, P/Sales, Dividend Yield (the infamous "Fed model"), and a couple of weird-looking relative strength metrics that appear to be based on momentum over the past 26 or 52 weeks. Out of those, I would tend toward favoring P/CF and P/B over the others.
Out of higher-growth countries, China and Israel look pretty good on that interactive chart.
Malaysia, Indonesia, and the U.K. (not a particularly high-growth country, I know, but it's a special case with Brexit) also look pretty good.
Mexico is edging into the pricey category (part of the reason why I dumped it on July 31), and India actually is much more expensive that I had first thought. However, India is able to get away with that somewhat because it has such high growth. You're buying growth stocks, not value stocks, when you go long with India.
(In contrast, the U.S. is experienced slower growth, and a lot of the corporate earnings projected and reported by Wall Street are pro-forma junk, compared to the more reliable GAAP numbers, which show that corporate earnings in 2017-Q2 will probably be the first to barely surpass corporate earnings back in 2014-Q3. All this with media headlines constantly shouting 10% growth in earnings!! But that's just not reality in an economy that is growing at a real annualized rate of less than 2% since 2000, which is much worse than even the Great Depression.)
Then there are countries that look like they have pretty good metrics (in continental Europe, Brazil, Japan, Russia, etc.), but which are mired in very serious systemic problems. Beware of stocks that are too cheap, since they are usually too cheap for a good reason.
The German website does not use the Buffett Indicator (market-cap-to-GNI or market-cap-to-GDP), Hussman's indicator (non-fin-market-cap-to-corp-GVA), or anything else measuring the totality of stock market capitalization to the size of the national economy. There's a good reason for that. Although these indicators are the best valuation metrics for projecting 12-year investment returns within a stable national economy like the U.S., they don't necessarily travel well across borders. As one website explains...
I did find one useful resource, however, from an undated article from the National Inflation Association (whatever that is) that appears to be from January 2015. It has bar charts showing the Buffett Indicator for 2015 versus the median Buffett Indicator over the years 1991-2015 for 22 different countries.
These charts make India and Chile look awesome, and they also tend to make the U.S. stock market look better than it really is. You have to wonder though, why in the world did they choose the limited timeframe of 1991-2015 to calculate their median? That kind of throws the whole exercise off, but I suppose when you are dealing with countries outside the U.S. and U.K., the quality of the economic and financial datasets starts to erode very quickly as you start going backwards in time. I suppose choosing 1991 as the starting point was the only way to squeeze in 22 different countries.
In any case, these are the international ETFs that I would most consider buying at this juncture:
Mexico ( EWW)
Indonesia ( EIDO)
China ( AFTY)
Hong Kong ( EWH)
India ( INDA)
Malaysia ( EWM)
Israel ( EIS)
U.K. ( EWU)
EDIT: Just for the sake of tracking purposes, I'll include the closing prices for each ETF.
IVV (U.S.) = 249.06
EWW (Mexico) = 56.49
EIDO (Indonesia) = 26.62
AFTY (Mainland China) = 16.03
EWH (Hong Kong) = 24.60
INDA (India) = 34.83
EWM (Malaysia) = 32.00
EIS (Israel) = 48.91
EWU (U.K.) = 34.38
Here ( LINK) is a German one from Star Capital, that shows several valuation metrics for different countries across the world. It uses Shiller's CAPE, P/E, P/CF, P/Book, P/Sales, Dividend Yield (the infamous "Fed model"), and a couple of weird-looking relative strength metrics that appear to be based on momentum over the past 26 or 52 weeks. Out of those, I would tend toward favoring P/CF and P/B over the others.
Out of higher-growth countries, China and Israel look pretty good on that interactive chart.
Malaysia, Indonesia, and the U.K. (not a particularly high-growth country, I know, but it's a special case with Brexit) also look pretty good.
Mexico is edging into the pricey category (part of the reason why I dumped it on July 31), and India actually is much more expensive that I had first thought. However, India is able to get away with that somewhat because it has such high growth. You're buying growth stocks, not value stocks, when you go long with India.
(In contrast, the U.S. is experienced slower growth, and a lot of the corporate earnings projected and reported by Wall Street are pro-forma junk, compared to the more reliable GAAP numbers, which show that corporate earnings in 2017-Q2 will probably be the first to barely surpass corporate earnings back in 2014-Q3. All this with media headlines constantly shouting 10% growth in earnings!! But that's just not reality in an economy that is growing at a real annualized rate of less than 2% since 2000, which is much worse than even the Great Depression.)
Then there are countries that look like they have pretty good metrics (in continental Europe, Brazil, Japan, Russia, etc.), but which are mired in very serious systemic problems. Beware of stocks that are too cheap, since they are usually too cheap for a good reason.
The German website does not use the Buffett Indicator (market-cap-to-GNI or market-cap-to-GDP), Hussman's indicator (non-fin-market-cap-to-corp-GVA), or anything else measuring the totality of stock market capitalization to the size of the national economy. There's a good reason for that. Although these indicators are the best valuation metrics for projecting 12-year investment returns within a stable national economy like the U.S., they don't necessarily travel well across borders. As one website explains...
quote:
Shortcomings of the Buffett Indicator
Dr. Ed Yardeni has pointed out some possible shortcomings of using the ratio to estimate the current market valuations. One potential problem is that Buffett Indicator does not take account structural changes in profit margins caused by e.g. changing tax rates, lower interest rates or technological innovations. Especially technologic advances have often been expected to lift corporate profits to a entirely new level but the evidence for this has remained mixed. As Dr. Yardeni states, there is no perfect indicator and stock valuation is always somewhat subjective. The best option is to follow multiple metrics and make your own conclusions about them.
I did find one useful resource, however, from an undated article from the National Inflation Association (whatever that is) that appears to be from January 2015. It has bar charts showing the Buffett Indicator for 2015 versus the median Buffett Indicator over the years 1991-2015 for 22 different countries.
These charts make India and Chile look awesome, and they also tend to make the U.S. stock market look better than it really is. You have to wonder though, why in the world did they choose the limited timeframe of 1991-2015 to calculate their median? That kind of throws the whole exercise off, but I suppose when you are dealing with countries outside the U.S. and U.K., the quality of the economic and financial datasets starts to erode very quickly as you start going backwards in time. I suppose choosing 1991 as the starting point was the only way to squeeze in 22 different countries.
In any case, these are the international ETFs that I would most consider buying at this juncture:
Mexico ( EWW)
Indonesia ( EIDO)
China ( AFTY)
Hong Kong ( EWH)
India ( INDA)
Malaysia ( EWM)
Israel ( EIS)
U.K. ( EWU)
EDIT: Just for the sake of tracking purposes, I'll include the closing prices for each ETF.
IVV (U.S.) = 249.06
EWW (Mexico) = 56.49
EIDO (Indonesia) = 26.62
AFTY (Mainland China) = 16.03
EWH (Hong Kong) = 24.60
INDA (India) = 34.83
EWM (Malaysia) = 32.00
EIS (Israel) = 48.91
EWU (U.K.) = 34.38
This post was edited on 8/5/17 at 8:52 pm
Posted on 8/6/17 at 1:32 pm to Doc Fenton
Tell you what, the more I read about Malaysia the more I like it
Posted on 8/6/17 at 2:09 pm to LSUtoOmaha
It looks great if you use Shiller's CAPE, but a lot of that looks like a consequence of high oil revenues from pre-2014. So with both Malaysia and Indonesia, you get good CAPE metrics, but very poor P/Sales metrics. It seems highly dependent on higher oil prices being maintained in the future.
The best value indices would seem to be for the U.K., Israel, Hong Kong, and mainland China. For the U.K. and Israel, those indices might be weighed down by international political risks. For China, there appears to be a huge debt bubble combined with government strong-arming of stocks and the financial sector, so there's not a lot of transparency about what will happen next.
India is expensive, and Mexico is becoming expensive, but these prices are perhaps justified by higher growth numbers.
The U.S. is expensive without the justification of higher growth numbers.
If a market correction doesn't happen within the next couple of months, I might go long equal weights with Israel, the U.K., Malaysia, and India.
By the way, Hussman has already released his weekly report for next Monday: " Estimating Market Losses at a Speculative Extreme." There's not a whole lot of new information there, but he focuses on (1) how the breadth of overvaluation (in terms of the median individual stock within the S&P 500) now is way worse than it ever was in 2000, and (2) that his "market internals" continue to show deterioration, as the FAANG-type of stocks are continuing to diverge from the rest of the pack.
quote:
We presently estimate median losses of about -63% in S&P 500 component stocks over the completion of the current market cycle. There is not a single decile of stocks for which we expect market losses of less than about -54% over the completion of the current market cycle
quote:
Notably, our measures of market internals deteriorated further last week, and the divergences are becoming evident in fairly obvious ways, as about 40% of U.S. equities have now declined below their respective 200-day moving averages
This post was edited on 8/6/17 at 2:12 pm
Posted on 8/15/17 at 8:37 am to Doc Fenton
Did you read yesterday's report from Hussman? It hits on low interest rates and valuation premiums. Also ties in nicely to macroeconomic indicators.
This post was edited on 8/15/17 at 8:38 am
Posted on 8/18/17 at 5:47 pm to LSUtoOmaha
I saw this a couple of days back, but it's just been a brutal work week that has totally worn me down. Anyway...
Yep. Read it Monday morning.
#1. We were just discussing dispersion last week, and then right after that, Hussman comes out with probably the most in-depth discussion of his dispersion metrics that I've ever read:
So it would appear that he seems to look (1) at dispersion of all stocks within the S&P 500, and (2) divergence of certain classes (transportation-vs-industrial; small-cap-vs-large-cap; low-rated-vs-high-rated) of stocks or bonds.
#2. He also made a pithy observation about the non-correlation between interest rates and future 10-12-year stock returns:
#3. He ventures again into some long-term macroeconomic projections, and this is where I would criticize him, particularly with respect to the faulty way he thinks about productivity growth.
That U.S. economic growth has entered shifted into a lower gear for the long-term is undeniable. I do a lot of these calculations myself in my spare time, and real annualized U.S. GDP growth went from 4.5% from 1790-1890, to 3.5% from 1890-1944, to 3.1% from 1944-2000, to 1.8% since 2000.
A lot of that has to do with lower population growth, but the "delta" between GDP growth and population growth has also been shrinking: 1.6% from 1790-1890 (in part because of such young populations and high childbirth rates), 2.0% from 1890-1944, 1.8% from 1944-2000, and 0.9% since 2000. Now it makes some sense to think of this "delta" (after adjusting for the percentage of the population actually in the work force) as worker productivity, but I cringe whenever I read stuff where people act like they can determine productivity from year-to-year. It just doesn't work that way.
There are too many other factors associated with monetary policy, global factors, and the economic business cycle, that cause the "delta" to swing wildly back and forth. You can't really compare worker productivity accurately unless you take into account the full effects of these cycles, and given that these cycles can be up to 20-30 years long, it just doesn't make any sense to say that the rate of "true" worker productivity growth has declined from 2000 to 2017.
Now I suppose a lot of that just has to do with semantics and how people feel like defining "productivity", but still, it gives a misleading impression. I guarantee you that the typical office group from 2017 would beat the living daylights out of a similar office group from 2000 in terms of efficiency and productivity. They just lived in different macroeconomic environments--2000 vs. 2017.
I would even go so far as to say that the U.S. has experienced a significant worker productivity "boom" over the past 10 years, because lean times makes people work twice as hard. But the measurable fruits of that efficiency won't show up in GDP numbers until after the full stock market cycle completes.
So all of that is just a long way of saying that, despite being a long-term growth pessimist similar to Hussman, I don't have quite as gloomy as a macro forecast as he does, due to the fact that I think that worker productivity is getting better, not worse. Now as for birth rates, demographics, housing policy, health care regulation, etc., that's where I share his gloom.
Finally, although I love Hussman's insights into long-term trends and behavior of the stock market, I admit that he may not be a very good portfolio manager. He called 2000 & 2007, and I think he's correctly calling a 3rd such occurrence (in 2017-18?), but his funds have performed very poorly since 2005. Then again, his main funds are market neutral (and thus is typically meant to act as a small hedge portion of an individual's total portfolio), so you can't really make apples-to-apples comparisons with other funds in terms of total returns. In any case, I believe him when he says there is a high probability that the market will drop well below 1,500 over the completion of the current market cycle.
quote:
Did you read yesterday's report from Hussman?
Yep. Read it Monday morning.
#1. We were just discussing dispersion last week, and then right after that, Hussman comes out with probably the most in-depth discussion of his dispersion metrics that I've ever read:
quote:
We extract signals about the preferences of investors toward speculation or risk-aversion based on the joint and sometimes subtle behavior of numerous markets and securities, so our inferences don't map to any short list of indicators. Still, internal dispersion is becoming apparent in measures that are increasingly obvious. For example, a growing proportion of individual stocks falling below their respective 200-day moving averages; widening divergences in leadership (as measured by the proportion of individual issues setting both new highs and new lows); widening dispersion across industry groups and sectors, for example, transportation versus industrial stocks, small-cap stocks versus large-cap stocks; and fresh divergences in the behavior of credit-sensitive junk debt versus debt securities of higher quality. All of this dispersion suggests that risk-aversion is rising, no longer subtly. Across history, this sort of shift in investor preferences, coupled with extreme overvalued, overbought, overbullish conditions, has been the hallmark of major peaks and subsequent market collapses.
So it would appear that he seems to look (1) at dispersion of all stocks within the S&P 500, and (2) divergence of certain classes (transportation-vs-industrial; small-cap-vs-large-cap; low-rated-vs-high-rated) of stocks or bonds.
#2. He also made a pithy observation about the non-correlation between interest rates and future 10-12-year stock returns:
quote:
Across history, the impact of variations in interest rates and growth rates systematically wash each other out, which is why long-term returns are so tightly linked to starting valuations (see Rarefied Air: Valuations and Subsequent Market Returns for a full exposition).
#3. He ventures again into some long-term macroeconomic projections, and this is where I would criticize him, particularly with respect to the faulty way he thinks about productivity growth.
quote:
With regard to future economic growth prospects, the fact is that demographic factors constrain likely U.S. labor force growth to just 0.3% annually in the coming years, while U.S. productivity growth has declined from 2% annually in the post-war period, to 1% annually over the past decade, and just 0.6% annually over the past 5 years. Add 0.3% and 0.6%, and the baseline expectation for U.S. economic growth in the coming years is just 0.9% annually, assuming that the unemployment rate does not rise at all from the current level of 4.3%. As I detailed in Stalling Engines: The Outlook for U.S. Economic Growth, even a future 1.85% trajectory for U.S. real GDP growth requires that some combination of labor force growth and productivity growth will accelerate from the current baseline.
Given that real U.S. GDP growth has averaged just 2.2% over the past 4 years, and that the current starting positions of labor force growth, unemployment, and the trade balance suggest a deceleration even from that average, we shouldn’t be surprised if real U.S. GDP growth amounts to just a fraction of a percent annually over the coming 4-year period.
That U.S. economic growth has entered shifted into a lower gear for the long-term is undeniable. I do a lot of these calculations myself in my spare time, and real annualized U.S. GDP growth went from 4.5% from 1790-1890, to 3.5% from 1890-1944, to 3.1% from 1944-2000, to 1.8% since 2000.
A lot of that has to do with lower population growth, but the "delta" between GDP growth and population growth has also been shrinking: 1.6% from 1790-1890 (in part because of such young populations and high childbirth rates), 2.0% from 1890-1944, 1.8% from 1944-2000, and 0.9% since 2000. Now it makes some sense to think of this "delta" (after adjusting for the percentage of the population actually in the work force) as worker productivity, but I cringe whenever I read stuff where people act like they can determine productivity from year-to-year. It just doesn't work that way.
There are too many other factors associated with monetary policy, global factors, and the economic business cycle, that cause the "delta" to swing wildly back and forth. You can't really compare worker productivity accurately unless you take into account the full effects of these cycles, and given that these cycles can be up to 20-30 years long, it just doesn't make any sense to say that the rate of "true" worker productivity growth has declined from 2000 to 2017.
Now I suppose a lot of that just has to do with semantics and how people feel like defining "productivity", but still, it gives a misleading impression. I guarantee you that the typical office group from 2017 would beat the living daylights out of a similar office group from 2000 in terms of efficiency and productivity. They just lived in different macroeconomic environments--2000 vs. 2017.
I would even go so far as to say that the U.S. has experienced a significant worker productivity "boom" over the past 10 years, because lean times makes people work twice as hard. But the measurable fruits of that efficiency won't show up in GDP numbers until after the full stock market cycle completes.
So all of that is just a long way of saying that, despite being a long-term growth pessimist similar to Hussman, I don't have quite as gloomy as a macro forecast as he does, due to the fact that I think that worker productivity is getting better, not worse. Now as for birth rates, demographics, housing policy, health care regulation, etc., that's where I share his gloom.
Finally, although I love Hussman's insights into long-term trends and behavior of the stock market, I admit that he may not be a very good portfolio manager. He called 2000 & 2007, and I think he's correctly calling a 3rd such occurrence (in 2017-18?), but his funds have performed very poorly since 2005. Then again, his main funds are market neutral (and thus is typically meant to act as a small hedge portion of an individual's total portfolio), so you can't really make apples-to-apples comparisons with other funds in terms of total returns. In any case, I believe him when he says there is a high probability that the market will drop well below 1,500 over the completion of the current market cycle.
Posted on 8/21/17 at 6:08 am to Doc Fenton
Hmmm, Hussman just effectively countered my productivity argument this morning: " Imaginary Growth Assumptions and the Steep Adjustment Ahead."
For some reason, in making my argument for a "productivity boom" over the past 10 years, I had totally forgotten the very basic argument linking productivity growth to capital investment. From Hussman:
So I hereby take back my criticism of his argument from last week. Offices are indeed getting leaner and more efficient, but the technology investment (despite all the inflated promises regarding Big Data, nanotech, quantum computing, AI, machine learning, and deep learning) really isn't there to the degree that it ought to be.
He also goes into much more depth regarding growth in corporate profits, which is the underlying basis to all stock market pricing fundamentals:
I haven't even finished reading this weekly report this morning, but man, this is already a really really good one.

For some reason, in making my argument for a "productivity boom" over the past 10 years, I had totally forgotten the very basic argument linking productivity growth to capital investment. From Hussman:
quote:
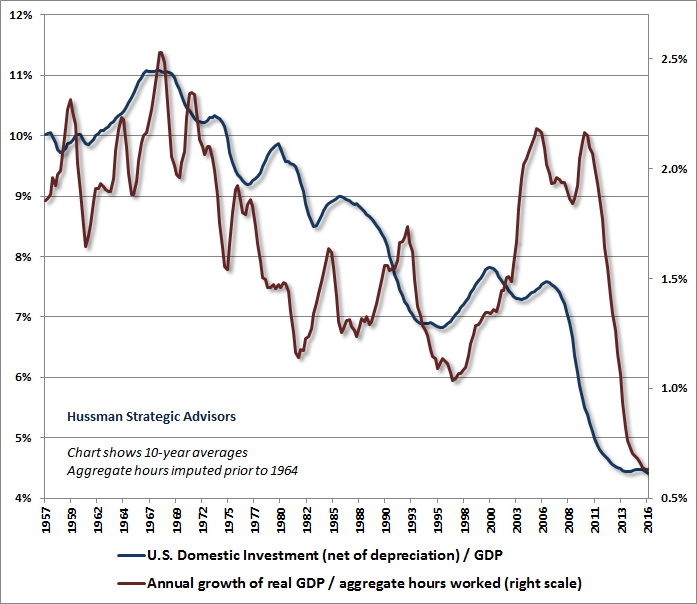
On the productivity front, booms in U.S. productivity are typically led by booms in U.S. gross domestic investment. As a historical regularity related to the savings-investment balance, such booms invariably emerge from an initial position of balance or surplus in the U.S. trade balance. Given the deep deficit at present, such a boom is not likely forthcoming. For more on these relationships, see Stalling Engines: The Outlook for U.S. Economic Growth.
So I hereby take back my criticism of his argument from last week. Offices are indeed getting leaner and more efficient, but the technology investment (despite all the inflated promises regarding Big Data, nanotech, quantum computing, AI, machine learning, and deep learning) really isn't there to the degree that it ought to be.
He also goes into much more depth regarding growth in corporate profits, which is the underlying basis to all stock market pricing fundamentals:
quote:
With regard to corporate revenues, from 1947 to 2000, the growth rate of S&P 500 revenues and earnings averaged over 6% annually. Indeed, including estimated foreign revenues, the gross value added of U.S. nonfinancial companies grew at a rate of nearly 7.6% annually. But like U.S. real GDP, those growth rates have also slowed dramatically over time. Indeed, nominal S&P 500 revenues have grown at a rate of just 2.7% annually since 2000, with 3.5% growth in nonfinancial GVA even including estimated foreign revenues. Over the most recent 10-year and 5-year periods, those rates have slowed even further, to an average nominal growth rate of scarcely 2% annually.
That’s why, despite an expansion to near-record profit margins, S&P 500 reported earnings have grown at a rate of just 4% annually since 2000, and just 1.7% annually over the past decade. It’s only the hypervaluation of equities, and growth measurements focused on trough-to-peak movements, that provide investors the illusion that growth in economic and corporate fundamentals has been more rapid.
Finally, with respect to earnings, I’ve noted that most of the fluctuation in U.S. corporate profit margins over time is closely linked to the difference between U.S. productivity growth and real wage growth (or equivalently, between growth in unit labor costs and growth in the GDP deflator). See This Time is Not Different, Because This Time is Always Different for more detail on these relationships. With the unemployment rate now down to 4.3%, the weak growth in labor compensation that supported the move to record profit margins in this half-cycle has already begun to reverse.
Put simply, within a small number of years, investors are likely to discover that they have allowed their assumptions about growth in U.S. GDP, corporate revenues, earnings, and their own investment returns to become radically misaligned with reality, and that Wall Street’s justifications for the present, offensive level of equity market valuations are illusory. Based on outcomes that have systematically followed prior valuation extremes, the accompanying adjustment in expectations is likely to be associated with one of the most violent market declines in U.S. history, even if interest rates remain persistently depressed.
I haven't even finished reading this weekly report this morning, but man, this is already a really really good one.
This post was edited on 8/21/17 at 6:13 am
Posted on 8/21/17 at 9:50 am to Doc Fenton
quote:
On the productivity front, booms in U.S. productivity are typically led by booms in U.S. gross domestic investment
I need to think about this but my immediate thought is skepticism. Too many potential confounding variables there as it ties into market performance. US GDP can rise but that macro indicator cannot necessarily be indicative of Total Stock Market returns. In fact, the correlation from 2009 to present has been almost twice as strong as the correlation for the 50 years prior.
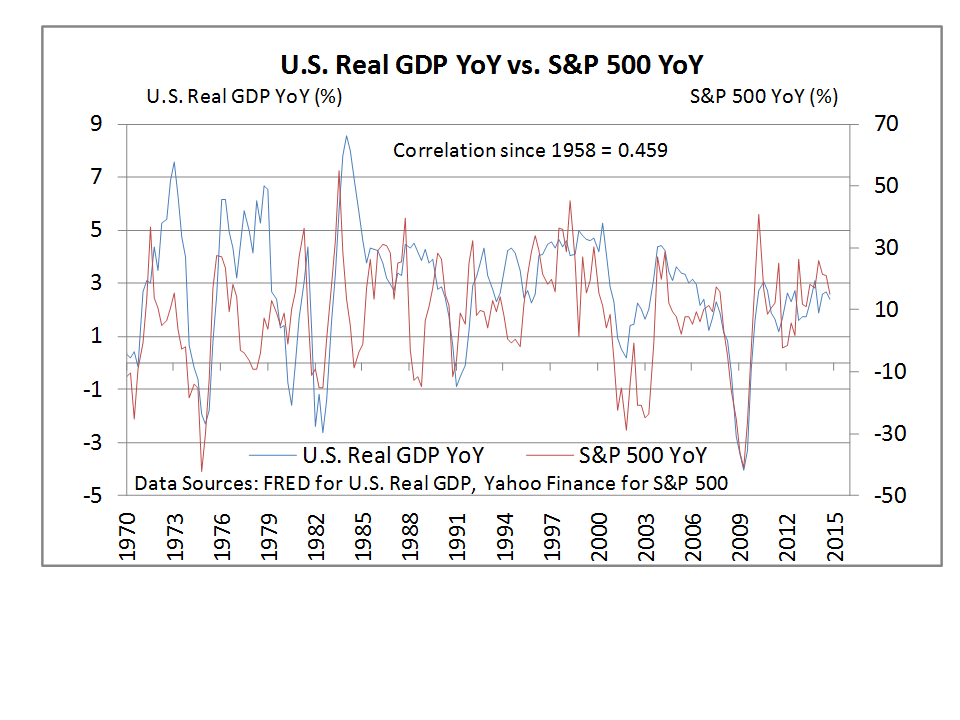
Of course, the caveat here would be that GDP would be a leading indicator, though I'm still pretty certain the above would maintain.
Possibly of interest to you is the ratio of index capitalization to GDP, which is significantly higher now than it has been since 2007. See the link below.
LINK
Regarding corporate profits, I think you and Hussman hit the nail on the head. Corporate S&P 500 shares are being valued at very high earning ratios (24 regular, 29 CAPE), and at ALL TIME sales ratios (2.7). Profit growth is a bit over the map, and sales growth is at, coincidentally, also 2.7.
For us to get back to the historical mean Price Sales Growth of 1.44, we would need sales to almost DOUBLE, if prices were held constant. How long do you think that would take? Even if you took the old 6% rule of thumb, that would take it would take 12 years to sustain these prices and historical Price sales ratios. From 2002 to now, sales have only increased by a total of 50%.
As long as more is going to the bottom line though, who cares, right? Well, earnings in 2017 will almost triple what they were in the 2002 trough. On the flip side, they are only double what they were in 1994, and less than what they were in 2013, (all inflation adjusted).
Since 1990, we have had 6 years in which earnings growth rates were over 20%. For 2017 alone I think we will hit around 14%. So, I guess the question is, is it really that far fetched for us to sustain such earnings growth?
From 1992 to 1996 we had 5 years of double digit earnings growth in the S&P 500. Thus, a doubling in the index price then was warranted. What is to prevent us for having a 5 year stretch like it from 2016-2020? If that happened, markets would be flat to marginally higher assuming we get back to PE ratio means by 2020. I guess this is my "best" case scenario, since the markets have already seemed to take this earnings growth into consideration.
LINK
So let's think about this. If profits rates are at a relative constant (bigger assumption), if revenue growth is at maximum capacity, what does that leave for earnings? An unsustainable constant at best that will trend downward. What does that do to Price/Earnings ratio? Increases it only further. And Price/Sales? Only increases that further too.
I don't necessarily agree with Hussman on the extremes of things though. Will these numbers, over time, revert back to their means? Almost certainly. Does that necessitate a 63% drop at once? Not necessarily. It depends on the sustainability of those profit and sales metrics over the course of the downward cycle. Of course, the market can be just as irrational in a bear market. Assuming nothing dramatic happens to profit margins and output, we can get back to historical ratios with more like a 40 percent drop.
This post was edited on 8/21/17 at 12:13 pm
Posted on 8/21/17 at 12:20 pm to LSUtoOmaha
So now, let's get micro for a second. What exactly is causing such high earnings rates? Surely all sectors are growing in tandem, right? Or, no. It could be tech! Think about Google and Apple and NVDA and the list goes on.
Nope
LINK
If you remove energy, Q2 earnings sector growth drops from 6.5 percent to 3.6 percent.

So what does the future of energy look like from a supply demand perspective? Projections below anticipate a consumption increase of about 0.6% total from 2016 to 2018, and a supply increase of about 8% for that same time period. Prices will likely fall for this sector, earnings growth will slow and the effect on macro earnings growth will be something to look out for.
LINK
Nope
LINK
If you remove energy, Q2 earnings sector growth drops from 6.5 percent to 3.6 percent.
So what does the future of energy look like from a supply demand perspective? Projections below anticipate a consumption increase of about 0.6% total from 2016 to 2018, and a supply increase of about 8% for that same time period. Prices will likely fall for this sector, earnings growth will slow and the effect on macro earnings growth will be something to look out for.
LINK
This post was edited on 8/21/17 at 1:07 pm

 Page 2 of 3

Popular
Back to top