- My Forums
- Tiger Rant
- LSU Recruiting
- SEC Rant
- Saints Talk
- Pelicans Talk
- More Sports Board
- Fantasy Sports
- Golf Board
- Soccer Board
- O-T Lounge
- Tech Board
- Home/Garden Board
- Outdoor Board
- Health/Fitness Board
- Movie/TV Board
- Book Board
- Music Board
- Political Talk
- Money Talk
- Fark Board
- Gaming Board
- Travel Board
- Food/Drink Board
- Ticket Exchange
- TD Help Board
Customize My Forums- View All Forums
- Show Left Links
- Topic Sort Options
- Trending Topics
- Recent Topics
- Active Topics
Started By
Message
A comic related to global warming. Are we doomed?
Posted on 9/17/16 at 9:37 am
Posted on 9/17/16 at 9:37 am

 15
15


Posted on 9/17/16 at 9:38 am to 75503Tiger
quote:k

Posted on 9/17/16 at 9:40 am to 75503Tiger

Posted on 9/17/16 at 9:41 am to 75503Tiger
Well id say we are fricked, so frick it
Posted on 9/17/16 at 9:44 am to DollaChoppa
I was hoping for a bill burr skit.
Posted on 9/17/16 at 9:53 am to 75503Tiger
Take ice core samples for 20,000 years.
Ignore the fact that they have a substantial margin of error.
Use the lowest possible temperature of the entire margin of error.
Look forward to a dramatic upward scale at the end when actual measured temperatures are used.
Draw this idiotic cartoon.
Ignore the fact that they have a substantial margin of error.
Use the lowest possible temperature of the entire margin of error.
Look forward to a dramatic upward scale at the end when actual measured temperatures are used.
Draw this idiotic cartoon.
This post was edited on 9/17/16 at 10:11 am

Posted on 9/17/16 at 9:57 am to 75503Tiger
Bruh, you didn't even link xkcd?
Posted on 9/17/16 at 10:00 am to 75503Tiger
The time line starts at mere 22000 BBC/-4 degrees yet the earth is millions of years old. An honest graph would show that the earth was hot as hell with tropics covering most of the land thousands of years before the depicted start date. And for what it's worth, most of the North Hemisphere contains most of the landmass on earth and is still extremely cold and darn near uninhabitable. The temperature range in Edmonton, AB (Canada) in March: 19 / 34°F, (-7 / 1°C) still possibility of snow. 
Posted on 9/17/16 at 10:45 am to 75503Tiger
(no message)
This post was edited on 9/17/16 at 10:49 am
Posted on 9/17/16 at 10:48 am to 75503Tiger
Can somebody get me a cold beer?
Posted on 9/17/16 at 11:18 am to 75503Tiger
Can we add average life span, infant mortality rate, per capita income, and average quality of life to that plot too? Any chance the supposed cause of the warning on the plot has also had a positive effect on these other things?
This post was edited on 9/17/16 at 11:21 am
Posted on 9/17/16 at 11:24 am to purpleleaf
If we all open our refrigerators, we can cool earth in no time.

Posted on 9/17/16 at 11:31 am to 75503Tiger
I like how at 18,600 B.C.E., changes in the earths orbit started all the shite, and everything's been a constant since then.
Posted on 9/17/16 at 11:32 am to Kafka
K?
Splain this message boarding stuff to a simple old boy, what the hell does your reply mean and why does everyone like it. I don't get it
Splain this message boarding stuff to a simple old boy, what the hell does your reply mean and why does everyone like it. I don't get it
Posted on 9/17/16 at 11:34 am to Meauxjeaux
I didn't laugh once
worst comic evAr
worst comic evAr
Posted on 9/17/16 at 11:39 am to OWLFAN86
Stick to the funny pages. This is a political cartoon pushing some liberal agenda that our kids will spontaneously combust soon. The caveman doing the NiN graffiti made me chuckle because I'm old and can recall when everyone was doing that
Posted on 9/17/16 at 1:05 pm to 75503Tiger
So earth is the hottest it's been in over 22000 years.
Posted on 9/17/16 at 2:26 pm to Kafka
I personally know several highly educated and very knowledgeable scientist: a few physicists (with PhDs) of various specialties, a medical physicist (MS), and a meteorologist. All of these people are in agreement that it is NOT a settled science.
Granted, none of these people are climate change researchers, but they have experience and have made careers out of the use of the scientific method, critical thinking, and the proper application of available evidence.
One man, a physics professor at LSU, has questioned the link between atmospheric gasses found in ice core samples and the reported temperatures. It is not that he doesn't believe there to be a link; he convincingly explained that the methods and formulae used to derive the historic temperatures has very little evidence to prove accuracy. In fact, if you look at long term core samples and compare them to other better documented forms of deriving temperature (plant growth, insect responses, etc.) then the temperature line changes (in many cases) before the atmospheric composition. This would seem to indicate that we have it backwards when we look to ice cores to report historic temperatures.
Furthermore, the chart shown by the OP only shows since the middle of the last ice age. It does not show what happened in the few hundred or thousand years before the last ice age. It is possible that this "strong" uptick is a common occurrence during the periods following or preceding an ice age.
Lets look at the past 60 million years:
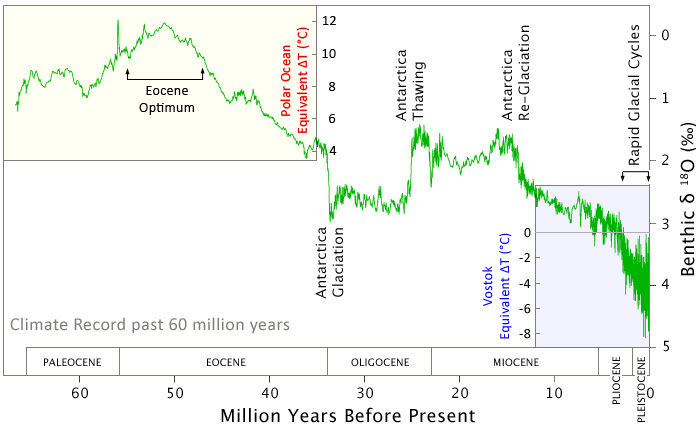
Looks like a cool period to me.
Lets look at the past 400k years:
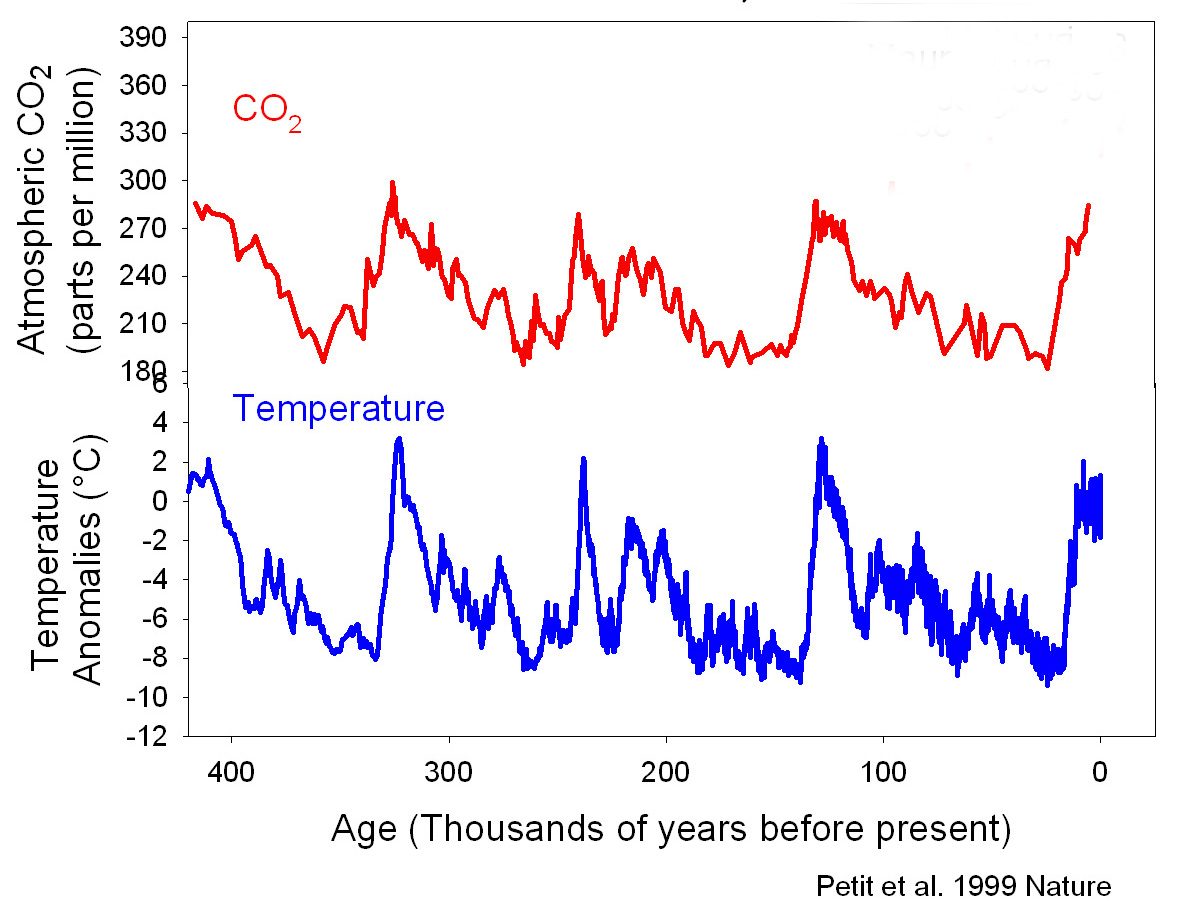
Looks like a cyclicle process to me.
Lastly, do those most recent readings (1900-present) take into account things like a city's heat-island effect? Do they account for the fact that we have a shite-ton more places that we are taking our readings from? And for the first time we have the ability to consistently record temperatures from highly isolated "hot" locations like the middle of deserts?
Granted, none of these people are climate change researchers, but they have experience and have made careers out of the use of the scientific method, critical thinking, and the proper application of available evidence.
One man, a physics professor at LSU, has questioned the link between atmospheric gasses found in ice core samples and the reported temperatures. It is not that he doesn't believe there to be a link; he convincingly explained that the methods and formulae used to derive the historic temperatures has very little evidence to prove accuracy. In fact, if you look at long term core samples and compare them to other better documented forms of deriving temperature (plant growth, insect responses, etc.) then the temperature line changes (in many cases) before the atmospheric composition. This would seem to indicate that we have it backwards when we look to ice cores to report historic temperatures.
Furthermore, the chart shown by the OP only shows since the middle of the last ice age. It does not show what happened in the few hundred or thousand years before the last ice age. It is possible that this "strong" uptick is a common occurrence during the periods following or preceding an ice age.
Lets look at the past 60 million years:
Looks like a cool period to me.
Lets look at the past 400k years:
Looks like a cyclicle process to me.
Lastly, do those most recent readings (1900-present) take into account things like a city's heat-island effect? Do they account for the fact that we have a shite-ton more places that we are taking our readings from? And for the first time we have the ability to consistently record temperatures from highly isolated "hot" locations like the middle of deserts?
Posted on 9/17/16 at 2:40 pm to 75503Tiger
I just don't get how some guy is smart enough to create the entire solar system in 6 days could let this happen....

 Page 1 of 3

Back to top