- My Forums
- Tiger Rant
- LSU Recruiting
- SEC Rant
- Saints Talk
- Pelicans Talk
- More Sports Board
- Fantasy Sports
- Golf Board
- Soccer Board
- O-T Lounge
- Tech Board
- Home/Garden Board
- Outdoor Board
- Health/Fitness Board
- Movie/TV Board
- Book Board
- Music Board
- Political Talk
- Money Talk
- Fark Board
- Gaming Board
- Travel Board
- Food/Drink Board
- Ticket Exchange
- TD Help Board
Customize My Forums- View All Forums
- Show Left Links
- Topic Sort Options
- Trending Topics
- Recent Topics
- Active Topics
Started By
Message
re: Daily COVID Updated as of 11/2/20 8:00 PM
Posted on 3/26/20 at 12:43 pm to Cosmo

Posted on 3/26/20 at 12:43 pm to Cosmo
quote:
Was listening to a podcast on monday with somebody from CDC that they felt if they were still below 100000 cases by friday they felt like they were in a good place whatever that means
it would mean our response measures are indeed blunting the growth.
Look at the graph and see how new case % has been dropping the last few days..imagine if it stayed at +40-+50% or even went higher. we would be at 100k easy by tomorrow
if we stay <100k, we're having an effect
This post was edited on 3/26/20 at 12:43 pm
 1
1


Posted on 3/26/20 at 12:47 pm to Chromdome35
I really appreciate all the work you've done compiling this data.
Posted on 3/26/20 at 12:48 pm to TeLeFaWx
Thank you
Posted on 3/26/20 at 12:51 pm to Damone
All of the above, unfortunately
If you click on the link Chrome has provided there is a chart in log scale of cases side by side with deaths. They have very consistently trended together.
I said the other day, hoping I would be wrong, that daily deaths are on trend to double about every 2.5 days. I haven’t seen any data yet to say the death trend curve is flattening.People that die this week, especially in NY, were probably infected before isolation and got serious right around the time that the info about the malaria drug/azithromycin combo came out. NY supposedly got 10,000 doses this week. So it may take another week to 10 days before the death trend curve starts to flatten significantly.
But if another dense population zone becomes a hot spot everything could spike again.
There is already a shortage of these drugs in a few states. They are generic so multiple companies can manufacture. The big one have stated they will donate millions of doses, but want to see definitely that it works.
I have read some of the randomized trials good have an interim look soon, but have not been able to verify on clinicaltrials.gov
Posted on 3/26/20 at 12:54 pm to NorCali
Is this the chart you are referring to NorCali?

This chart is based on the same data but with a timeframe going back to the start of the tracking, and it's line vs column :)

This chart is based on the same data but with a timeframe going back to the start of the tracking, and it's line vs column :)

Posted on 3/26/20 at 12:55 pm to the808bass
Glad to hear that

Posted on 3/26/20 at 12:58 pm to Chromdome35
About time they started reporting recoveries. It was becoming painfully clear that they weren't.
Posted on 3/26/20 at 1:24 pm to Chromdome35
Well we know at least one reason why China's numbers are declining.
https://news.yahoo.com/spain-europes-worst-hit-country-134444472.html
"Spain said it found that rapid coronavirus tests bought from China did not consistently identify positive cases and would return them to the manufacturer. ~ The Spanish newspaper El País reported that microbiologists found that tests it bought from a Chinese company called Bioeasy could correctly identify virus cases only 30% of the time."
This post was edited on 3/26/20 at 1:25 pm
Posted on 3/26/20 at 1:28 pm to Chromdome35
Yes that is the data I find very informative
If no intervention works post exposure, the cases will peak and bend then the death will follow after.
If an intervention works and is used widely, like hydroxychloroquine/azithromycin, then the deaths will start to separate lower and plateau/peak before the cases peak.
This guess is based on assumptions that they are only giving the interventions to serious cases and no prophylaxis for new cases, like a vaccine, becomes wide spread soon.
I would guess that we are at least a week to 10 days out from seeing the deaths bend down, but hoping for sooner. It depends on how many hospitals were aggressive in NY and how soon they started the combo, assuming it works. If the effect is similar to the French study, it should have a benefit, but time will tell
Posted on 3/26/20 at 1:43 pm to Tiguar
With New Jersey's number they just dropped, we will be over 100,000 tomorrow easily.
Posted on 3/26/20 at 1:44 pm to OnwardToMAyhem
Yes, today's trends are making it look like today with be a new high in deaths. I am just hoping we are less than 300 deaths today.
On a positive note the recoveries are now(2pm Thursday) more than deaths.
On a positive note the recoveries are now(2pm Thursday) more than deaths.
This post was edited on 3/26/20 at 2:00 pm
Posted on 3/26/20 at 2:09 pm to Chromdome35
This is the link to the COVID-19 tracker that I have shared on Google Drive. Chromdome's COVID-19 Daily Tracker
The source for the data is https://www.worldometers.info/coronavirus/
The source for the testing data is from https://covidtracking.com/data/
On the tracker sheet you will see tabs for the following data:
1) US Summary
2) Country Comparables: This shows you how the US stacks up vs. select other countries dealing with COVID-19
3) Italy Summary
4) UK Summary
5) France Summary
6) Germany Summary
7) US Weighted Averages - Explores 7 day vs 3 day weight average trends
8) Predictive Model - A simple predictive model that shows where the numbers will be in the future if growth rates don't change
New Tabs Added in the last day
9) Logarithmic Comparisons - Shows the US vs the other countries on the tracker.
10) Sweden Summary
If you would like a graph created that I don't have, just ask and if it's possible I will create it for you.
Due to space constraints on the PT board, I'm only posting a few graphs in the thread, if a consensus emerges of what graphs the PT wants to see in thread without having to go to the tracker, I will gladly change them up.
I am working to create a sheet that compares the US metrics to the other countries metrics. I'll let you all know when that's done and available.
NOTE: The daily growth rate data will not be accurate until the end of the day's postings. It will change throughout the day.
NOTE: I am not tracking individual states, I don't have a reliable consistent source for that data.
NOTE: I am not a mathematician, statistics guru, scientist, sharpest tack in the box, I'm just a guy who likes to understand for myself what is happening and to share it with others. This thread was not created to debate if you should or shouldn't take this seriously, it is simply to present the numbers and foster conversation.
Posted on 3/26/20 at 2:18 pm to TigerFanatic99
We'll probably pass China and Italy today in total # of cases.
Of course, China's lying and Italy is much smaller.
Of course, China's lying and Italy is much smaller.
Posted on 3/26/20 at 2:20 pm to Chromdome35
quote:
We'll probably pass China and Italy today in total # of cases.
Of course, China's lying and Italy is much smaller.
I am not sure Italy has really cared about real accurate numbers in the last 2 weeks. It's hard to believe they are accurate with all the cases and deaths they have had. Not knocking them, just saying they aren't lying like China or Russia just not able to accurately get counts.
Posted on 3/26/20 at 2:36 pm to Chromdome35
Once that daily new case number starts staying the same, we can probably reasonably expect to be about at the peak. One could argue that we’re almost already there (especially if you treat NYC as an outlier), but that’s yet to be seen. Hopefully the numbers stay down.
This post was edited on 3/26/20 at 2:40 pm
Posted on 3/26/20 at 2:54 pm to Ingloriousbastard
I WANT to agree with you that we are almost there, but I don't see it in the numbers yet.
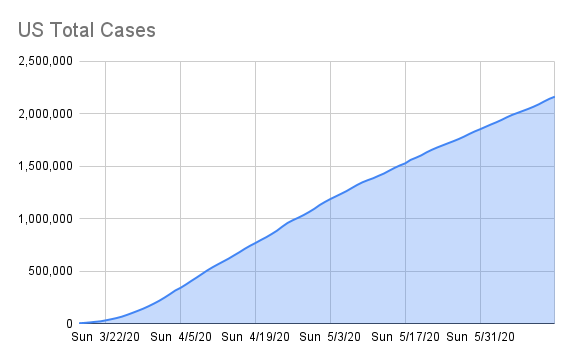
To see what a flattening curve looks like, consider these charts from the Italy Summary Tab on the tracker vs. the same charts from the US.

Notice how the past several days the numbers on the Italy chart are remaining about the same. That is what a flattening growth curve looks like.
Looking at New deaths by day

Also, compare the Logarithmic growth charts from both countries. You can easily see the flattening of the Italian curves which isn't showing up yet in the US data.

VS

The data from the US isn't showing that we're flattening at all yet. There is a slight hint of a flattening at the top of the US chart; however, until the full day's numbers are in, we can't really tell.
All that being said, we could be flattening and it just hasn't shown up in the numbers at this point (let's pray this is the case).
To see what a flattening curve looks like, consider these charts from the Italy Summary Tab on the tracker vs. the same charts from the US.
Notice how the past several days the numbers on the Italy chart are remaining about the same. That is what a flattening growth curve looks like.
Looking at New deaths by day
Also, compare the Logarithmic growth charts from both countries. You can easily see the flattening of the Italian curves which isn't showing up yet in the US data.
VS
The data from the US isn't showing that we're flattening at all yet. There is a slight hint of a flattening at the top of the US chart; however, until the full day's numbers are in, we can't really tell.
All that being said, we could be flattening and it just hasn't shown up in the numbers at this point (let's pray this is the case).
This post was edited on 3/26/20 at 3:25 pm

Posted on 3/26/20 at 3:00 pm to Chromdome35
Looks like we can expect to see Italy's curve begin to fall in the coming days. That bodes well.
Posted on 3/26/20 at 3:12 pm to Chromdome35
Good point. I’m hoping that we are currently getting close to the top. I’d also be curious to see what the numbers would look like minus NYC. I’m not asking you for that though.
I really appreciate all of your work here.
I really appreciate all of your work here.

Posted on 3/26/20 at 3:26 pm to TeLeFaWx
quote:
I really appreciate all the work you've done compiling this data.
This.
Posted on 3/26/20 at 3:26 pm to Chromdome35
Most trends say we are 11 days behind Italy. Even if we were relatively aggressive with containment and social distancing, that might only shift the trend a day or two. Which means we should see a flattening around the 29th or 30th best case.

 Page 78 of 331

Back to top